
Silver Commodity Deep Dive
1) Executive Summary
Thesis
After the sharp last-months price movements, silver still faces high volatility and upside potential over the next months as structural deficits and low deliverable inventories continue to impose a systematic risk premium being incorporated into prices.
Key Drivers
Supply: Silver supply is highly inelastic: mostly extracted as a by-product of other metals.
Also purification and after-mining processes being concentrated mostly in China (around 70 of global refining) create a concentration risk.
Demand: Demand is led by China and India, with the first being the largest non-refined silver buyer and the latter the largest refined silver buyer. On top of it, India demand is supplied mostly by Hong Kong and the UK increasing the concentration risk.
Inventories: With demand spiking and no elastic supply to fulfil it, silver stockpiles around the globe have been steadily decreasing. LBMA registered silver has fallen roughly 23% to around 27,000 tonnes. This has increased leverage and coverage risk. With stockpiles falling to years-low delivery months are becoming more prone to stress (and thus volatility and price spikes).
Policy/constraints: China moved to limited exports of silver from Jan 1, 2026, and U.S. policy uncertainty after silver was added to the critical minerals list in November 2025 increased friction risks in the supply chain and physical availability.
Scenarios
Base Case: The current tightness persists with the supply deficit continuing to drain the stockpiles buffer with financing/availability signals remaining elevated.
In the meanwhile registered stocks, conversions from eligible ones and higher premia allow delivery months to settle without a squeeze.Bull Case: Deliverable scarcity becomes acute during and/or after March; registered inventories and coverage (already under the 15% stress threshold) continue to fall. The market thus clears through a deeper backwardation, spikes in lease rates and a widening of EFP.
Bear Case: Fall in demand, mainly a cooling of India’s import pulse and/or silver being mobilized leads to spreads mean-reverting around the world and vault holdings stabilizing or even rebuilding. Thus proving that silver is more available than feared and the current risk premia incorporated into prices falls.
Catalyst Timeline (Next 3-6 months)
Mar 2026: Historically being the peak delivery month, it will be important to watch registered inventories and the coverage of open interest to understand the direction in which the market is heading.
Early May: on the 5th business day LBMA publishes previous month vault data. It will be important to focus on how inventories behave after the peak-delivery month. Inventories rebuilding would signal downward pressure on prices as risks stabilize and decrease.
Overall period: Tracking India imports and overall global demand will allow to form better estimates for 2026 supply deficits (as supply won’t sharply deviate from being strongly inelastic).
Overall period: Observing China export policy and US tariffs will allow to better estimate the policy risk and how they will affect the overall global market for silver
2) Commodity Primer
Benchmarks/grades, main geographies
LBMA Precious Metal Prices - https://www.lbma.org.uk/prices-and-data/precious-metal-prices#/
COMEX Silver Futures - https://www.cmegroup.com/markets/metals/precious/silver.html
Largest Silver Reserve Holders [USGS, 2026]
Peru
Australia
Russia
Poland
China
Largest Silver Producers [USGS, 2026]
Mexico
China
Peru
Bolivia
Poland
Who produces/consumes/stores, basic value chain analysis
Latin America is a global silver hotspot; Mexico, alone, is the world's top silver producer - consistently producing 6000+ metric tons annually with its large number of mines allowing production to account for nearly 25% of global output. Whilst Mexico leads in production, Peru holds the world's largest silver reserves, possessing over 140,000 metric tons of silver.
Consumption of this precious metal can largely be viewed as possessing a ‘split personality’. Not only does silver hold value as a safe haven, consumed based on changing investor sentiment, but it also attracts a large volume of industrial demand. Commercial uses of silver make up over ¾ of its global demand as a result of its largely versatile use. Silver’s vast properties are utilised in sectors ranging from healthcare to the jewellery market. The metal also plays a large role in processes such as water purification (serving as an electrode) and also acts as a catalyst in the production of major industrial chemicals.
Silver is stored in its physical form in key high-security facilities in order to remain stable as both a physical commodity and investor asset. Key companies that facilitate the trade of silver and other commodities manage its storage. The CME group, through its subsidiary COMEX (Commodity Exchange Inc) is the world's primary source for the exchange and storage of metals like Silver. Additionally, individual investors, funds or large banks also hold private vaults in order to store the metal; particularly if industrial storage is required, this will be in the form of raw silver bars in their semi-processed forms.
Silver’s value chain runs formerly from its extraction and mining in Latin America; through to its refining and processing, predominantly in East Asia; to finally its fabrication and industrial usage.
Upstream - Whilst lacking the largest silver reserves, Mexico and China lead on silver production with their more established mining techniques and technology. Silver possesses a short-run inelastic supply, largely as a result of its supply originating as a by-product of mining other metals (including Copper, Lead and Zinc). Thus, as demand spikes, prices can rise significantly as supply cannot immediately catch up. Yet as Mexico and China improve their technology, there is likely to be more long term flexibility.
Midstream - At this stage, silver is purified and processed through removal of its base metals. This is largely based in China, which controls 70% of global Silver refining - posing a large concentration risk as a consequence of its 2026 export licensing controls, permitting only 44 companies to export silver. This tightening of global supply will keep silver prices elevated.
Downstream - The final phase of the value chain is the first one to recognise any tightness or supply disruption, largely as a result of silver’s versatile uses in industry. Through fabrication, silver is transformed into wire, power, paste for solar panels, coins and jewellery. As these stakeholders are the ones to receive the metal, they’ll be able to notice any change in supply.
How it trades: spot vs futures, key contract specs, seasonality
Precious metals, like silver, can often be traded in two manners.
‘Spot’ refers to buying or selling an asset for immediate delivery at the current market price, providing direct ownership of the metal. This is often done using the measure of XAG - measuring how much of a currency (i.e USD) can be used to purchase one troy ounce of silver.
‘Futures’ refer to a contract, in other words ‘paper silver’, allowing the owner to buy or sell silver at a set price on a future date. These contracts can either remain standing for physical delivery or they can be rolled over to the next delivery month.
In regards to Silver, this metal is largely traded through futures contracts via COMEX. Contracts serve as the popular choice as this facilitates speculation on price movement, allowing the contract owner to hedge a price risk without needing to hold the physical metal. Crucially, only 5-10% of Silver contracts stand for physical delivery historically, meaning that most contracts are rolled over to the next month rather than delivered at the prescribed date.
This is a crucial fact to note at this critical point in time for Silver. Currently, there is a growing trend indicating a reversal of history - more contract owners are now demanding physical silver rather than rolling over these contracts. This is largely based on the current fear of physical shortages: with the sentiment that physical premiums are rising and that supply chains are stressed. This means that it is more valuable for investors to own physical silver which can be sold in physical markets.
Paper markets do not always reflect the immediate physical availability of silver: meaning that the volume specified in a futures contract is not guaranteed to reflect the physical supply of silver at the time of the end of the contract. This is a more crucial distinction now given the growing investor trend towards claiming for physical delivery. In March 2026, with 76.5 million oz of registered silver in comparison to paper silver valued at 667 million oz: the paper claims for silver are around 8.7x greater than the physical registered silver.
Key contract specs for silver: [https://www.cmegroup.com/markets/metals/precious/silver.contractSpecs.html]
Contract size - 5000 troy ounces
Price quotation - USD per troy ounce
Grade / quality - minimum 999 fineness
Tick size - 0.005 per troy ounce
This refers to the smallest increment by which a contract’s price can move up or down
The tick value is 0.005 X 5000 = 25
Relatively high tick value, theoretical maximum risk will rise: you can gain or lose $25
Delivery structure - physical delivery, occurring any business day during the business month
Links paper to physical silver
There are certain months in the delivery calendar that can be classified as more ‘quiet’ months as opposed to higher delivery months. March is classified as the highest delivery month annually, as the first major expiry of the year, which also makes it a systematic risk month: posing the question as to whether there is enough available, registered silver based off of futures contracts.
Months such as January and February, typically quiet months, had unorthodox demand this year: with 50 million ounces of Silver delivered in 2026 (as opposed to the usual pattern of contract owners ‘rolling over’ their contracts to the following delivery period). More people demanding physical silver exemplifies a structural change in the market, as minor months are now beginning to behave like major months. As such, March is a critical month to evaluate in Silver’s annual cycle. Historically, Q1 demand has been shaped by festivities in Eastern countries such as India and China, with Western industrial demand picking up more meaningfully in Q2 as manufacturing cycles accelerate. Besides this, Q4 has traditionally been the other major demand window, driven by India's Diwali and festive period. The fact that January and February are now seeing outsized delivery volumes - outside of these conventional demand clusters - suggests the structural shift is broad-based, not concentrated in any single country or season.
3. Price Formation Framework
Silver's price is not set by a single force. It is the product of five overlapping layers: the supply-demand balance, storage economics, geography of differentials, structural chokepoints, and financial positioning.
3.1 Supply-demand balance
The fundamental identity driving silver prices is simple: when supply exceeds demand, inventories build and prices soften; when demand exceeds supply, inventories draw down and prices rise. What makes silver distinctive is the persistence and scale of its current deficit.
According to the World Silver Survey 2025 [Silver Institute, 2025], total mine supply reached 819.7 Moz in 2024, up 0.9% year-on-year, while recycling (the recovery of silver from end-of-life industrial products, jewellery scrap, and electronic waste back into usable refined metal) contributed 193.9 Moz, a twelve-year high. Against total demand of 1,162.5 Moz, this left a structural deficit of 148.9 Moz in 2024 alone. The cumulative deficit from 2021 through 2024 reached 678 Moz, roughly ten months of global mine supply. The Silver Institute projects a sixth consecutive deficit in 2026 [Silver Institute, February 2026]. It has to be noted that deficits do not cause immediate price spikes; they drain the inventory buffer, and when that buffer shrinks, the market becomes progressively more sensitive to any demand surge or supply disruption.
3.2 Storage Economics (Contago and Backwardation)
Silver normally trades in contango since futures prices sit above spot, reflecting the cost of carrying physical metal forward (storage, insurance, financing). This is the baseline state in a well-supplied market. Expressed as an equation,
Futures Price = Spot Price + Storage Cost + Financing Cost − Convenience Yield
Backwardation (where spot price exceeds futures price) is rare for silver and historically significant. It signals that buyers are paying a premium for immediate physical delivery, meaning near-term supply is genuinely scarce. This connects directly to Section 2's point on the growing trend of contract holders demanding physical delivery rather than rolling over. The silver market entered deep backwardation in October 2025, with front-month contracts trading $2.88 above later-dated contracts, the steepest inversion since the 1980s. At the same time, silver lease rates (the annualised cost of borrowing physical silver, normally below 1% and considered elevated above 2%) surged to a peak of 39% before moderating to approximately 11% [Investing.com, 2025].
Movements like these are indicative of a severe physical liquidity squeeze, since bullion banks and dealers faced limited metal available for lending. Historically, lease rates breaching the 2% stress threshold have preceded price rallies of 20-50% within 6-12 months [GoldBroker, 2025]. Lease rates are therefore a critical early indicator of physical supply stress.
3.3 Location and Quality Constraints
It has to be foregrounded that silver does not trade at one uniform global price; meaningful premiums and discounts thus exist based on location, form and route.
The primary divide is between London and New York. London, through the LBMA, is the central OTC physical hub; COMEX in New York is the primary futures hub. Under normal conditions, COMEX trades only marginally above LBMA spot, a spread known as the Exchange for Physical (EFP), typically around $0.25/oz. When this widens sharply, it signals U.S. demand is outpacing London supply. In 2025, the EFP widened to as much as $1.10/oz [Bullion Trading LLC, 2025].
A third pricing centre adds complexity. The Shanghai Futures Exchange (SHFE) reflects Chinese industrial demand. When Chinese manufacturing accelerates, SHFE prices trade at a premium above London. This Shanghai premium typically appears 4-6 weeks before the demand surge shows up in headline data, making it a useful leading indicator.
Beyond geography, the form of silver also creates price variation. Solar manufacturers require high-purity silver paste; electronics producers require specific bar formats. Retail products carry fabrication premiums of $4-8/oz over spot under normal conditions, widening during stress periods. Together, the EFP, the Shanghai premium, and fabrication spreads reveal more about physical tightness than the benchmark price alone.
3.4 Structural Chokepoints
Even if the balance appears manageable on paper, structural constraints can prevent metal from moving quickly to where it is needed.
The most fundamental is byproduct mining dependency. As covered in Section 2, approximately 72-80% of global silver output is a byproduct of copper, zinc, lead, and gold mining. Production decisions are driven by the economics of the primary metal, not silver prices, making supply inelastic in the short run.
Refining concentration compounds this. China controls approximately 70% of global silver refining capacity. The recent 2026 export licensing controls (limiting silver exports to 44 approved companies, each shipment requiring government sign-off) have now created a direct supply chokepoint. Processing times at major refiners extended by a full week during the 2025 stress period [Bullion Trading LLC, 2025].
COMEX registered stocks add a third constraint. With approximately 76.5 million oz of registered silver against paper claims of around 667 million oz, the paper-to-physical leverage ratio sits at approximately 8.7x [CME Group].
Finally, ETF lock-up removes metal from active circulation. Global silver ETP holdings stand at an estimated 1.31 billion oz as of February 2026 [Silver Institute, February 2026]. Metal held in ETF custody is functionally unavailable to industrial users or futures market participants, compounding tightness across all other layers
3.5 Volatility of silver
Silver carries a larger speculative overlay than almost any other industrial commodity. This means price can diverge from physical fundamentals for extended periods, but when physical tightness forces a repricing, the financial layer amplifies the move.
The CFTC's weekly Commitment of Traders report [cftc.gov] shows how financial traders are positioned. When managed money is net short or neutral while physical supply is tight, there are fewer buyers to absorb rising demand pressure. When these traders eventually respond, their buying amplifies a move already underway. When weak speculative positioning coincides with tight physical supply, it has historically been one of the strongest conditions for a silver price rally.
The gold-silver ratio provides a relative value lens. The ratio historically fluctuates between 60:1 and 80:1. By end-2025 it had narrowed to approximately 65:1 (gold around $4,340/oz, silver around $66/oz), indicating silver retains relative value versus gold within historical norms [NAGA, 2026].
Silver's implied volatility typically runs 2-3 times that of gold, reflecting its smaller market size and dual industrial-monetary nature. When physical tightness becomes visible to financial markets, volatility rises and call skew steepens as industrial users bid up upside protection, creating a self-reinforcing dynamic.
3.6 Overlap of layers
Silver's price formation follows a consistent sequence. First, the balance deteriorates and inventories draw down. Then the curve responds; lease rates rise, the contango compresses. Next, differentials widen as buyers compete across geographies for available supply. Chokepoints are exposed because product supply cannot respond, registered stocks fall, ETF holdings lock away metal. Finally, the financial layer amplifies the move as speculative positioning builds and volatility rises. This is why silver's price moves, when they come, tend to be fast and violent. The physical market tightens slowly and invisibly; the financial market remains disengaged until a catalyst (be it a lease rate spike, a backwardation signal or a registered stock drawdown) breaks the dam.
4) Supply Deep Dive (with constraints)
Production Map and Concentration Risk
Global silver mine production is roughly 25,000 to 26,000 metric tonnes per year. Output has remained broadly stable over the past decade with a gradual downward trend. Production remains below the peak reached in 2016. Current estimates indicate that 2025 production is lower than 2020 levels despite pandemic disruption. This suggests a slow contraction in global mine supply.
Silver production is geographically concentrated. Mexico, China and Peru are the three largest producing countries and together account for roughly 50 percent of global mine supply. Production is regionally clustered across Latin America where Mexico and Peru host large mining industries.
Production trends across major producers remain stable overall. Mexico is showing a downward trend, with output falling from a peak of roughly 235-240 million ounces in 2016 to approximately 202 million ounces in 2023 and an estimated 186 million ounces in 2024. This decline reflects maturing mines, declining ore grades with grade falls of 20-26% reported at Fresnillo's key operations in recent periods and reserve depletion outpacing new discoveries, with consolidated silver reserves falling over 8% since 2020.
In contrast Peru, the United States and India have recorded some of the fastest production growth in recent years.
Mining activity in major producing countries faces risks from labour disputes, community protests and regulatory pressure. Silver exports are not dependent on a single strategic chokepoint comparable to the Strait of Hormuz in oil markets. However several locations act as important trading hubs including Hong Kong, China, Mexico and Peru.
A defining feature of silver supply is the reliance on by-product production. Around 72% of global silver output is produced as a by-product of mining other metals including lead, zinc, copper and gold. This structure creates a key supply dynamic. Production is driven by the economics of these primary metals rather than silver prices alone. As a result silver supply is relatively price inelastic and higher prices do not automatically generate rapid increases in production.
Short-run responsiveness vs long-run cycle
In the short run, silver supply is highly inelastic and responds only weakly to changes in price. Most silver mines already operate close to full capacity in order to spread high fixed costs across maximum output. These fixed costs include capital infrastructure such as shafts and processing equipment, permanent labour forces, energy contracts, and debt repayments all of which accrue regardless of how much silver is produced. As a result, there is very little spare capacity that can be activated quickly when prices rise.
Production levels are also constrained by geological factors such as ore grade and the fixed processing throughput of mills and refineries. Unlike a factory, a mine cannot simply run faster: mills are engineered to a maximum daily tonnage, and exceeding that limit causes mechanical failures and reduces metal recovery rates. Even when prices increase significantly, producers have limited ability to raise output beyond marginal operational adjustments.
A key factor behind this limited responsiveness is the structure of silver production. Around 70 to 80 percent of global silver supply is produced as a by-product of mining other metals such as copper. In practice, silver is extracted from the residues of the copper refining process after ore is smelted and electrolytically refined, the precious metals that settle out are recovered as a separate product. Because production decisions are driven primarily by the economics of these primary metals rather than silver prices, a rise in the silver price alone does not typically lead to higher mine output. In the short term, higher prices may encourage operators to process lower-grade ore or extend the life of existing mines, but these adjustments generally have only modest effects on total production.
Short-run supply can also be influenced by operational disruptions rather than price incentives. Silver mining operations are exposed to weather events, equipment failures, and labour disputes. Labour strikes in major producing countries such as Mexico and Peru which together account for roughly 40 percent of global mine supply have historically removed significant volumes of silver from the market; disputes at large copper-silver operations have at times lasted months or years. Weather-related disruptions such as flooding of open-pit mines during the Andean wet season or extreme temperatures freezing processing circuits can also interrupt operations, though these events typically cause temporary supply shocks rather than sustained changes in production capacity.
In contrast, meaningful changes in silver supply occur primarily through the long-run investment cycle. Developing a new silver mine typically takes seven to ten years and sometimes longer, reflecting the time required for exploration, feasibility studies, permitting, financing, and construction. Each stage carries substantial costs from tens of millions in exploration and studies to hundreds of millions or more in construction and permitting alone can take several years where environmental regulations and community consultation are required. As a result, global silver supply expands slowly and tends to follow long investment cycles rather than short-term price movements.
The comparison between short-run responsiveness and the long-run supply cycle highlights a key structural feature of the silver market. Supply cannot adjust quickly to higher prices in the near term, while meaningful increases in production require many years of investment and project development. Consequently, market adjustments often occur through changes in inventories and price volatility rather than rapid increases in mine supply.
Cost curve logic
Primary silver mines generally represent the higher-cost portion of the global cost curve because their profitability depends more directly on the price of silver. These operations are more sensitive to price fluctuations and may reduce production or delay expansion when prices fall below their operating costs. All-in sustaining costs for primary producers typically range from around $12 - 16 per ounce in Mexico to $14 - 18 in Peru, with more remote operations in Bolivia or Argentina sometimes exceeding $20 per ounce. When prices fall toward these thresholds, operators will generally curtail output or place mines on care and maintenance rather than sustain losses. In contrast, by-product producers can continue supplying silver even when silver prices are relatively low because the economics of the primary metal being mined remain profitable.
This structure means that the marginal cost of silver production is often determined by a smaller subset of primary silver producers rather than the entire market. When silver prices fall significantly, primary silver mines may reduce output or delay investment, while by-product production continues as long as copper or zinc mining remains profitable. Conversely, when silver prices rise sharply, the response from mine supply is limited because most production decisions are tied to other metals.
As a result, the silver cost curve tends to be relatively flat compared with other commodities. The dominance of by-product supply dampens the sensitivity of production to silver prices and reinforces the structural rigidity of global mine supply.
Key supply constraints
Several structural constraints limit the potential for rapid growth in global silver supply. One of the most important is the level of capital investment in new mining projects. Developing a new mine requires significant upfront capital expenditure and long development timelines typically seven to ten years from discovery to first production, encompassing exploration, feasibility studies, permitting, financing, and construction. Periods of low metal prices often lead mining companies to reduce exploration spending and delay new projects, which can create supply gaps later when demand strengthens.
Resource depletion also represents a growing constraint for silver production. Many of the world's largest silver mines are mature operations where ore grades have gradually declined over time. Global average silver ore grades have fallen by roughly 50 percent over the past two decades, and new discoveries have become increasingly rare and lower in quality. As existing deposits are exhausted, replacement supply is harder to find - exploration success rates are low, and newly discovered deposits tend to be smaller, deeper, and in more remote locations than those found in previous generations.
As ore grades fall, more rock must be processed to produce the same amount of silver, increasing operating costs and reducing production efficiency. This dynamic is already visible in major producing countries such as Mexico, where operations including Fresnillo's namesake mine and Peñoles' Naica complex have reported declining grades and output as their most accessible reserves are depleted.
Political and regulatory factors further complicate the supply outlook. Mining projects are frequently exposed to changes in taxation, environmental regulation, and resource nationalism. In Mexico, recent years have brought reforms restricting open-pit mining and tightening water use permits, while Peru has seen repeated cycles of windfall profit taxes and community-driven project suspensions. In both countries, the underlying tension is between governments seeking a greater share of resource revenues and investors requiring stable, predictable conditions to justify long-dated capital commitments. Until fiscal and regulatory frameworks offer greater certainty, new project development will remain subdued.
Permitting requirements represent another major barrier to expanding supply. Obtaining environmental approvals and community consent for new mining projects can take many years, particularly in jurisdictions where local opposition to large-scale mining has intensified. These regulatory hurdles slow the pace at which new mines can be brought into production even when market conditions would otherwise justify investment.
Finally, geopolitical tensions can have a meaningful impact on silver supply chains. Silver is the best electrical conductor of any metal and a critical input in solar panels, electronics, and electric vehicles, making it strategically important in ways that extend well beyond its monetary role. China dominates global silver refining capacity, processing a significant share of the world's silver concentrate, which creates concentration risk in the event of trade restrictions or diplomatic tensions. Disruptions to Chinese refining capacity or export flows whether from sanctions, tariffs, or broader geopolitical realignments could materially tighten refined silver availability globally.
Taken together, these constraints reinforce the structural rigidity of global silver supply. Limited investment, declining ore grades, regulatory barriers, and periodic operational disruptions all contribute to a supply profile that is slow to expand even when market conditions become favourable.
Silver extraction begins underground or in open pits, where ore is blasted, crushed, and ground into a fine powder. The resulting material is processed through flotation or leaching circuits to produce a concentrate or doré bar - a semi-pure alloy of silver and gold. This intermediate product is then sent to a refinery, where electrolytic or chemical processes separate the silver to a purity of 99.9 percent or higher before it enters the market.
5) Demand Deep Dive (end-use + elasticity
Cyclical vs structural drivers
Silver demand is shaped by two distinct forces that operate on different timescales. Cyclical drivers are tied to the broader economic cycle - industrial production, manufacturing output, and consumer spending all influence near-term silver consumption. In periods of strong growth, demand from electronics, automotive, and construction-related applications rises; in downturns, it contracts. These fluctuations tend to be relatively predictable and mean-reverting.
Structural drivers, by contrast, reflect longer-term shifts in technology and policy that create durable changes in the demand base. The most significant of these is the energy transition. As global solar installations have scaled rapidly, this single end-use has become one of the largest and fastest-growing sources of silver demand - absorbing 197.6 Moz in 2024, up from 118 Moz in 2022, and growing its share of industrial silver demand from 11% in 2014 to 29% by 2024 (Silver Institute, World Silver Survey 2025). Similarly, the electrification of vehicles is expanding silver consumption in power electronics, charging infrastructure, and battery management systems - EVs require approximately 25 - 50g of silver per vehicle compared to 15 - 28g for internal combustion engine models. Unlike cyclical demand, these structural tailwinds do not reverse with the economic cycle - they compound over time as deployment accelerates. The cumulative impact is visible in the supply-demand balance: the market has run a physical deficit for four consecutive years, with the combined 2021 - 2024 shortfall reaching 678 Moz - equivalent to roughly 10 months of annual mine supply.
Substitution pathways and limits
Silver's physical properties, particularly its unmatched electrical conductivity and reflectivity make it difficult to substitute in many applications. In solar panels, manufacturers have made progress in reducing the silver content per cell through thinner printing techniques and passivated contact designs, though the concurrent shift to TOPCon cell architecture - which overtook PERC as the dominant format for the first time in 2024 - actually increases silver intensity by approximately 50% per cell, but eliminating silver entirely has so far proved impractical at scale without sacrificing efficiency. In electronics, copper and aluminium can replace silver in some lower-specification applications, but not where conductivity or reliability requirements are stringent.
Substitution is more feasible at the margin in areas such as brazing alloys, photography, and certain industrial coatings, where alternative materials have already displaced significant silver demand over the past two decades. The practical conclusion is that substitution tends to occur in legacy or low-criticality applications, while the fastest-growing end-uses - solar, EVs, and advanced electronics - remain structurally dependent on silver with limited near-term alternatives.
Top demand indicators and why they lead or lag
Several indicators are closely watched as proxies for silver demand. Global solar installation capacity additions are among the most important leading indicators, given the direct relationship between photovoltaic deployment and silver consumption; announcements of national renewable energy targets and utility-scale project pipelines tend to lead actual silver offtake by twelve to twenty-four months. The IEA projects global solar additions will average 540 GW annually through 2035, providing a concrete baseline for forward silver demand from this channel. Semiconductor fab utilisation rates and consumer electronics order books provide a shorter-horizon lead on industrial demand, typically running one to two quarters ahead of silver purchases.
Automotive production volumes, particularly for electric and hybrid vehicles, are another key indicator, though they tend to be coincident rather than leading - silver is consumed at the point of manufacture rather than during the design phase. On the investment side, ETF holdings and futures positioning data act as real-time sentiment indicators, often moving ahead of physical demand as investors anticipate macroeconomic or supply-side developments. Lagging indicators include reported mine production and refinery output figures, which are published with a delay and reflect conditions that existed months earlier rather than current market dynamics.
6. Inventories, Flows, and the Physical Market (truth layer)
6.1 Definitions
The word "inventory" can be defined through four distinct main categories.
Firstly, COMEX Registered Silver is physical metal held in CME-approved New York vaults with a warehouse warrant, meaning it can be delivered immediately to settle an expiring futures contract. As noted in Section 2, registered stocks now sit at 76.5 million oz against paper claims of approximately 667 million oz, a leverage ratio of 8.7x.
Secondly, COMEX Eligible Silver meets COMEX specifications but is privately owned and stored without a delivery warrant. At approximately 278 million oz it appears as vault stock, but is not accessible without its owner's consent. Total COMEX stocks can look healthy while registered stocks simultaneously signal severe tightness.
Thirdly, LBMA Vault Holdings represent London's contribution to the global stock picture. The LBMA publishes total vault holdings monthly with a six-week lag [LBMA]. The main thing to consider in this case is the difference between headline vault holdings and free float; the portion actually available for lending and trading. Much of what sits in London vaults is held in long-term ETF custody and is functionally unavailable. Estimates of London free float in early 2025 were a fraction of the 850 Moz headline figure [Investing.com, October 2025].
Lastly, ETF Holdings, held by products such as SLV, PSLV, PHAG, and ZKB, represent the most locked-up category. Once vaulted, this metal is only released when shareholders redeem in physical form, which most retail holders do not do. Global ETP holdings stand at an estimated 1.31 billion oz as of February 2026 [Silver Institute, February 2026].
6.2 Where the Stocks Sit
As of March 6, 2026, COMEX registered silver stands at approximately 27 Moz, down over 80% from its 2021 peak. Paper leverage sits at 6.9x, with a coverage ratio of 14.4%; below the 15% threshold considered stress territory. Some predictions are especially pessimistic, saying that at the current withdrawal pace, registered silver could possibly be exhausted in approximately 80 trading days [goldsilver.ai, March 2026].
The most recent LBMA vault data for end-January 2026 shows 27,729 tonnes ( around 891 Moz) in London vaults, a three-year high, as metal flowed back following the October 2025 stress episode [LBMA, January 2026]. This headline figure obscures the free-float problem. On October 10, 2025, the London market seized up for 1.5 hours despite approximately 140 Moz of non-ETF silver sitting in London vaults, metal that was technically present but entirely unavailable [Jensen, Substack, November 2025]. The recovery in London holdings reflects emergency inflows, not a structural easing; lease rates remain elevated at around 3.3% [BullionVault, January 2026].
The five largest silver exporters are Hong Kong, mainland China, the UK, Mexico, and Germany. China's dominance reflects its role as the world's largest refining centre; silver from Latin America is processed domestically and re-exported globally. During January to November 2025, China exported approximately 4,600 tonnes against imports of just 220 tonnes [Kotak MF, 2026]. From January 1, 2026, China placed silver under an approval-based export licensing regime, with only 44 authorised companies permitted to export. This is a structural tightening of global supply with no precedent in the modern silver market.
For silver ore, China dominates imports with $4.2 billion in 2023, sourced from Peru, Mexico, and Bolivia. South Korea ($280m) and Japan ($77m) follow [Global Trade Magazine, 2024]. For refined silver, India has emerged as the single most important buyer globally, importing an estimated $9.2 billion in 2025, a 44% increase over 2024, accounting for approximately 21.4% of global refined silver trade [BasisPointInsight, January 2026]. India's sourcing is heavily concentrated: Hong Kong (38.4%) and the UK (31.7%) together account for roughly 70% of Indian imports, making London's free-float directly exposed to Indian demand spikes.
6.3 Trade Flows and Chokepoints
Silver moves through a concentrated global pipeline. Primary mining in Latin America feeds silver concentrate into Chinese refining infrastructure, which processes it into refined metal before it flows into London and New York, from where it is distributed globally. Because the system relies on a small number of logistics corridors and refining centres, disruptions at any node translate quickly into price dislocations.
The corridor between London and New York operates through the EFP mechanism, which under normal conditions keeps both markets tightly aligned through continuous arbitrage. In 2025, this corridor became the central fault line of the global silver market. London silver traded approximately $1.55 above COMEX, driven partly by policy uncertainty after silver was added to the U.S. critical minerals list in September 2025, introducing the possibility of import tariffs up to 50%.
When the EFP spread widens to this degree, traders must physically move metal to capture the arbitrage. In 2025, some traders booked commercial transatlantic cargo space on airlines to move silver from London to New York. Air freight is normally reserved for gold, which has a far higher value-to-weight ratio. Its use for silver signals severe geographic dislocation.
China's monthly imports of silver ore and concentrate provide an early signal of future refined silver demand. In 2024, major suppliers were Peru ($2.17 billion), Mexico ($1.47 billion), and Bolivia ($759 million). Because concentrate must be refined before entering the global market, changes in import volumes lead refined supply and industrial demand by approximately 3-6 months, making this one of the most useful leading indicators available.
6.4 Physical Pricing
The LBMA benchmark is the global wholesale reference price, but the actual price paid for physical silver varies by location, form, and market conditions. These adjustments appear through the EFP basis, retail premiums, bid-ask spreads, and freight costs.
The EFP spread is the primary basis measure. Under normal conditions it sits at $0.20-$0.30/oz. In 2025 this inverted, with London trading approximately $1.55 above COMEX. A growing proportion of EFP transactions are now settling in cash rather than physical metal, suggesting LBMA inventories are tightening and the market is becoming more reliant on paper settlement [Metal Market Europe, 2025]. When EFPs stop settling in physical metal, the link between paper price and physical reality begins to fray.
At the retail end, American Silver Eagle coins typically command $4-8/oz above spot, while generic bars carry $1-3/oz premiums. When generic bar premiums exceed $3/oz or coin premiums exceed $7, it signals stress in the wholesale supply chain [apmex.com].
In the London OTC market, the bid-ask spread normally sits at a few cents per ounce. During the October 2025 stress, several banks withdrew from market-making, widening spreads to more than $0.20/oz. This increases volatility and weakens arbitrage, making it harder for prices to return to equilibrium.
Transport costs become significant during dislocation events. Sea freight between London and New York costs $0.05-$0.10/oz, whereas air freight is much more expensive at $0.50-$1.50/oz. The willingness of traders in 2025 to absorb air freight costs for silver (a metal with a low value-to-weight ratio) is one of the clearest signals of how severe the geographic dislocation had become.
7) Market Structure & Signals (curve/spreads/vol)
Historical regimes (tight vs loose markets)
Historical regimes characterise the different states that the silver market has been over time. When regimes are tight, this means that supply is scarce, relative to demand. In contrast, loose regimes possess plenty of silver supply: where inventory is comfortable and the metal is easy to borrow.
Here, we’ve identified some of the most consequential regimes in silver’s history.
1 - US Gov Control (Pre 1960s)
Previously, the US government acted as the largest seller within the Silver market - as such, making the market artificially loose. In order to fix the price, the government held massive stock piles. For instance, if demand would rise (tightening the market) , the government would simply sell from their stockpiles and inject the supply in order to keep the price capped at a fixed rate.
Yet, worldwide consumption of silver more than doubled, driven by industrial growth in the 1960s and 70s in various sectors. This depleted government stockpiles, tightening the market massively and increasing pressure.
2- ‘Silver Thursday’
In the 1970s, there was a prolonged period of ‘Great Inflation’ driven by the Iranian Revolution causing an oil crisis, a wage-price spiral and low interest rates. During this sustained period of high prices, various investors sought out precious metals as a means of seeking a hedge against inflation, which destroyed the value of paper money.
Two investors, The Hunt Brothers, accumulated a significant volume of physical silver and futures contracts: amounting to an estimated 100 million ounces. This demand significantly pushed up the price of silver, prompting further speculation from other investors which subsequently pushed up the price further (in other words, reflexivity).
In just 12 months, silver went from $6.08 per troy ounce to almost $50 per troy ounce, the highest on record. It was only through intervention by COMEX, through regulatory changes to its margin rules, which restricted these investors from adding to their positions.
When investors could no longer meet COMEX’s new margin requirements, the price of silver crashed dropping by over 50% in a single day (Silver Thursday). This attempt to manufacture tightness within the silver market was one which had large repercussions for those holding silver: this tightness ultimately collapsed when regulations were implemented.
3 - Modern Commodities Demand / Financial Crash (2001-2011)
In the aftermath of the dot com bubble crash and central banks’ 2009 quantitative easing programs, investors began to pour into commodities such as Silver, whilst simultaneously facing industrial demand. In this regime, this was one of the most genuine, tightest regimes in Silver’s market history.
In 2006, the SLV (iShares Silver Trust - an exchange traded fund) launched which provided ordinary investors the chance to buy into the silver regime. Additionally, China was in the midst of its largest phase of industrialisation, uti I’m ilising a range of commodities in manufacturing, electronics, urbanisation and more. The coexistence of these two avenues of demand pushed the price of Silver up to nearly $50 an ounce by April 2011.
4 - The Present
Silver is likely to continue to face a prolonged period of tightness at present. With a number of governments committing to the green energy transition and renewable energy targets, silver has begun to be demanded at its largest scale yet through its usage as a paste in the production of solar panels. With no viable alternatives to silver being discovered for this process yet, the demand for silver is significantly inelastic.
On the other side, investor demand fluctuates significantly with the geopolitical landscape constantly changing; from Trump’s extensive protectionism program in 2025 to growing conflict in the Middle East impacting other commodities.
At present, with COMEX registered stocks falling below 100 million ounces for the first time in years, this tightness is not just manufactured or easily resolvable, it is based on structural and macro imbalances - making this regime one of the most important in silver’s modern day.
Which spreads matter most and why
Spreads are simply price differences that reveal information about the market structure of a commodity at a given time period. Some of the key spreads for silver are: lease rates, the EFP spread and backwardation risks. With each spread indicating whether the stress point is in financing, physical availability or another critical injunction point.
Lease rates simply refer to the cost of borrowing physical silver. If Silver is scarce in the market, lease rates spike (above 0%) as this indicates that borrowers are paying extra to secure physical silver. Thus, if silver is oversupplied in the market, then lease rates are low. As of March 2026, a previously established major delivery month for the commodity, the lease rate sits at 6% on average - a chronic sign of stress.
The EFP (exchange for physical) spread refers to the difference between London spot prices and COMEX futures prices. Historically, this is typically a $0.25 spread, taking into account the financing and logistics costs. Yet, the widening of this spread serves as a signal of stress between paper and physical markets in recent periods - with an estimated $2.50 spread, which is still well above norms; catalyzed through forces such as China’s export controls, decoupling the paper and physical prices.
Finally, backwardation is crucial to trace. Backwardation is where spot prices are more expensive than futures price; essentially, investors are paying a premium to acquire physical silver. This is also a key signal in identifying a tight market.
As these spreads start to showcase that the price between physical and paper silver are beginning to widen, they start to become a signal of structural tightness within the market.
Volatility/skew
As a relatively small market, small moves can lead to big changes in silver prices. Silver prices are highly volatile as a direct result of its rigidity in supply as well as inelasticity in demand [see sections 4 & 5], with both structural and industrial factors compounding this further. Physical tightness combined with China’s export controls drives the already innate volatility of the metal. With the backdrop of the US-Iran war impacting inflation and monetary policy, seemingly making the future of Silver look bullish.
Yet, in response to spikes earlier in the year amid speculation of the metal ‘running out’, a 300% margin hike and a leveraged ETF rebalancing has driven prices sharply lower than before - even as physical demand remains high. [Wall Street Bullion, 2025]
Ultimately, it is the tension between these competing forces - physical scarcity and surging real demand on one side, and COMEX and regulatory intervention on the other - which serves as the primary driver of silver's heightened volatility.
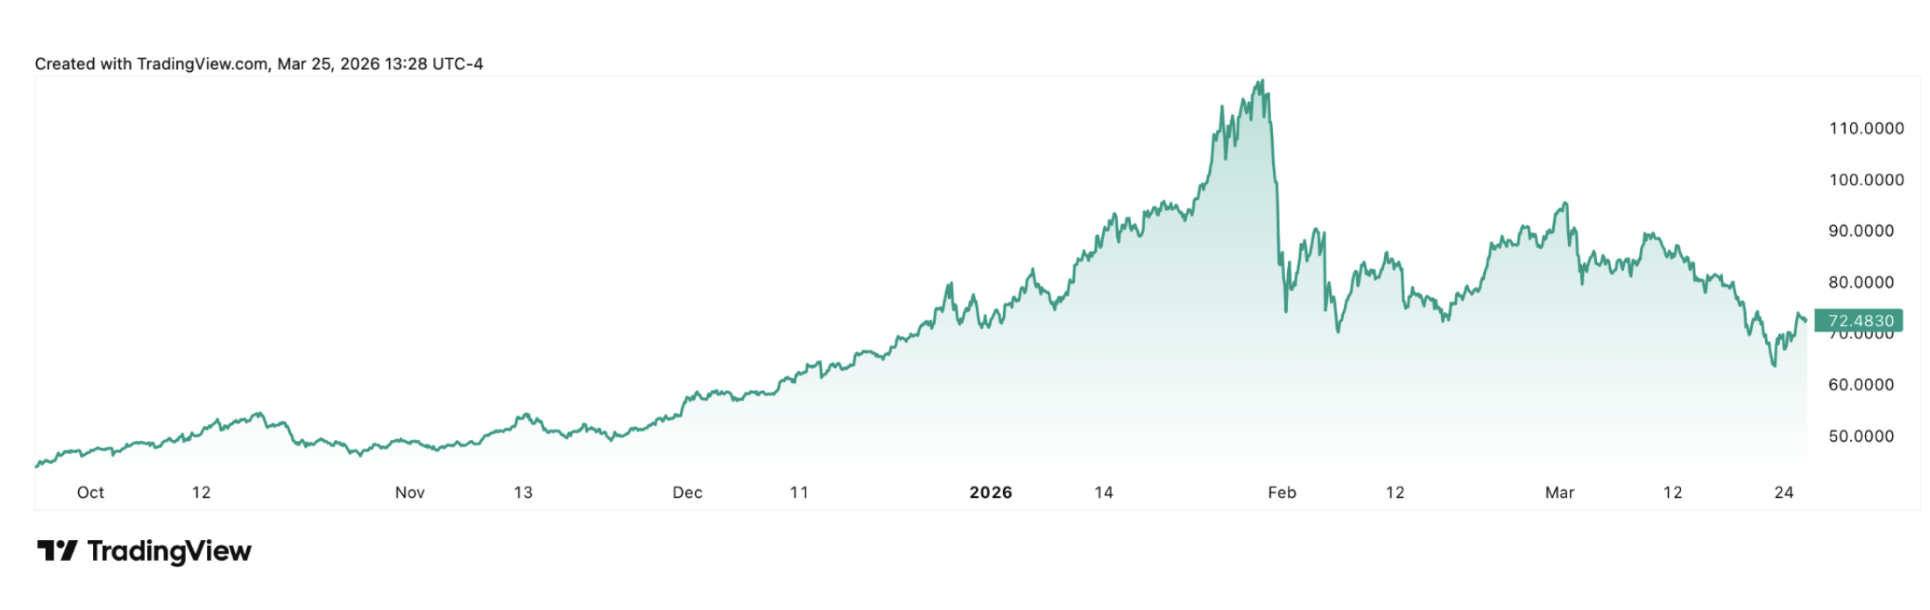
Silver Spot Price / US Dollar Diagram: October 2025 - March 2026
Reflexivity risks (price → flows/inventory behavior)
Silver is seeing large reflexivity risks, meaning that changes in the price ultimately change the fundamentals of the metal (similar to the ‘Silver Thursday’ regime). As Silver prices have been rising sharply in 2026, due to the demand for physical silver exceeding what’s registered, investor money is now flowing into ETFs (exchange traded funds) such as the iShares Silver Trust.
Through ETFs, investors are able to gain exposure to metals without buying physical spot silver or holding futures contracts, An ETF simply holds physical silver in a vault, and an investment into the ETF represents an investors 'share or proportional claim onto silver. Despite not having direct ownership over the metal, investors are still tightening the market and driving the prices higher; which is further prompting more investors to move towards ETFs as a direct result of the 2025-2026 price surge.
8) Risks + Falsifiers + Monitoring Dashboard
Risks (ranked by Impact × Likelihood)
Demand destruction/substitution (High × Medium-High).
Industrial and consumer demand can respond faster than supply when prices gap higher (higher elasticity of demand compared to supply). If high prices persist, “tightness” can fade without new mine supply, we would expect:Substitution in photovoltaic and electronics sector
Weaker jewellery demand
Registered inventories rebuild (High × Low).
Our thesis depends on deliverable tightness. A sustained rise in registered stocks (via eligible-to-registered conversions) or a reversal in LBMA vault trends would relieve stress.Policy reversal / de-escalation (Medium × Medium).
China’s exports tightening through a “whitelist” regime and the U.S. inclusion of silver into the 2025 Critical Minerals List increases geopolitical risks.
However any political deal between China and Western countries on exports and/or a U.S. decision to lower restrictions would reduce the geopolitical risk premia.Market-structure intervention (Medium × High).
CME margin hikes, position-limit enforcement, or dealer risk-off behaviour can compress spreads and force liquidation even if physical remains tight (classic “Silver Thursday” mechanics in modern form).Macro headwinds (Medium × Medium).
A sharp rise in real yields/USD or a growth shock that hits industrial activity could overwhelm the scarcity narrative short-term.
Hard falsifiers (“what proves us wrong”)
The bullish tightness thesis is that structural deficits, low derivable inventories, concentration and geopolitical risks and declining overall stockpile are leading towards a bullish outlook. This thesis would be considered falsified if at least two of the following scenarios happen in the coming months:
Deliverable buffer rebuild: The Registered/OI ratio rises back above the stress level (≥ 15%) and contemporarily COMEX registered inventories reach more than 120 Moz.
Financing stress normalizes: London lease rates decrease below 2% and remain below that level, signalling an end to a high stress period.
London availability rebuilds: LBMA silver vault holdings rise ≥2% m/m for two consecutive months.
ETF de-grossing: Silver-backed ETFs face net outflows freeing up silver for active circulation
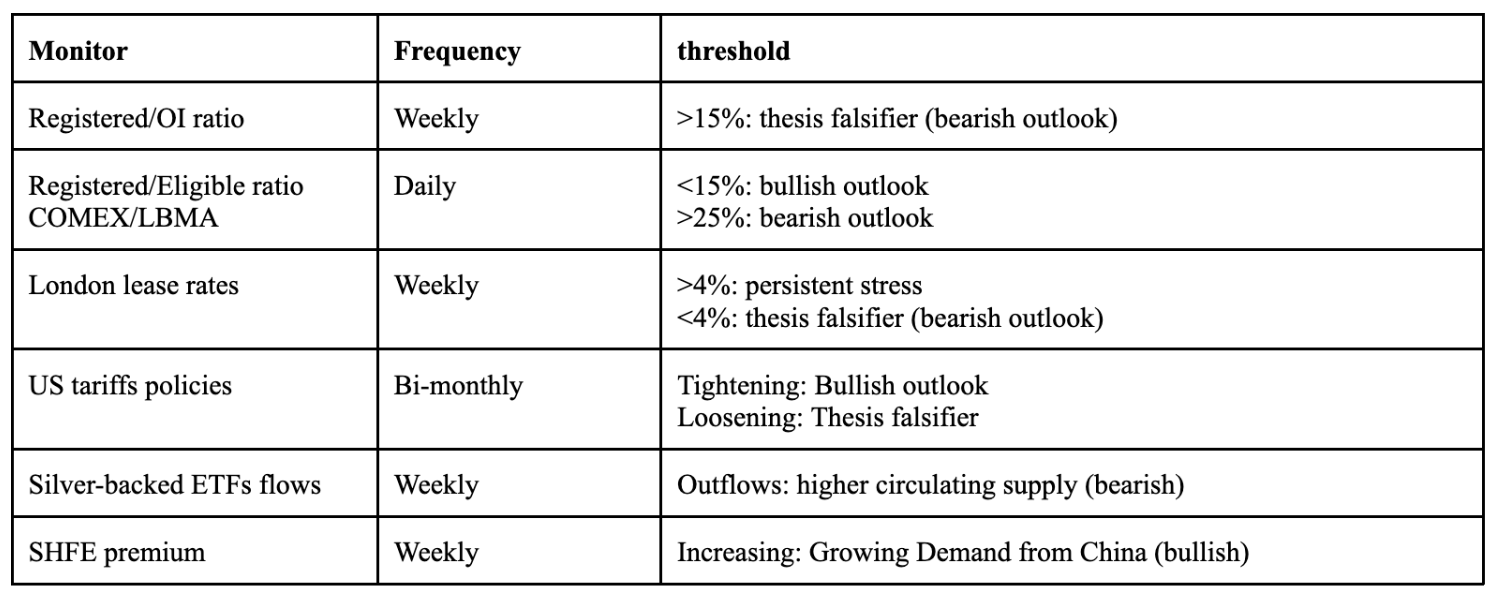
Monitoring dashboard (weekly/monthly)