
EUR/USD: Is Europe's Fiscal Pivot Enough?
Executive Summary
Europe is moving towards a more activist fiscal stance, with higher spending on defence, energy security, industrial policy, and rearmament, which is driven by hybrid warfare, the Russia-Ukraine conflict, and broader geopolitical fragmentation .However, the fiscal impulse remains broadly neutral in 2025-26, as new investment is offset by consolidation elsewhere. The macro stimulus is therefore relatively small compared to the scale of the structural challenges Europe faces. The composition of spending is more constructive: greater defence investment and R&D could not only support productivity but also crowd in private capital by encouraging private markets to invest alongside the government. If effectively implemented, this could improve Europe’s medium-term growth profile and attract steady capital inflows. However, if it is poorly executed or heavily reliant on imports, it would limit the impact to a short-term cyclical boost with little improvement on Europe’s long term economic outlook. In foreign exchange markets, Europe still faces a long term disadvantage compared to the United States. The US maintains a productivity and capital market advantage that supports higher returns and a stronger dollar bias. Rate differentials and relative growth momentum remain the primary EUR/USD drivers. While the dollar has softened against the euro since February 2025 - partly reflecting shifting rate expectations and reduced safe-haven demand - this is likely cyclical rather than a structural reversal of the US productivity and capital market advantage. Europe’s fiscal pivot reduces downside risks and supports tactical EUR resilience, but unless Europe clearly improves productivity and starts to close the gap with the US in growth and interest rates, the euro is unlikely to strengthen in a lasting way.Macro Regime
1) Global Cycle Snapshot: Growth, Inflation & Liquidity
The global economy is in a late-cycle deceleration - not collapse, but a clear loss of post-pandemic momentum. Inflation has broadly been tamed across advanced economies, returning policymakers to a more normal signalling environment after three years of emergency tightening. The Fed delivered 75bp of cuts in 2025; the ECB completed a 200bp cutting cycle from its 4.0% peak to 2.0%. Growth divergence between the US and euro area remains the dominant macro story. The US runs at approximately twice the euro area growth rate. That gap is not narrowing materially, and it is the single most important structural headwind for EUR/USD.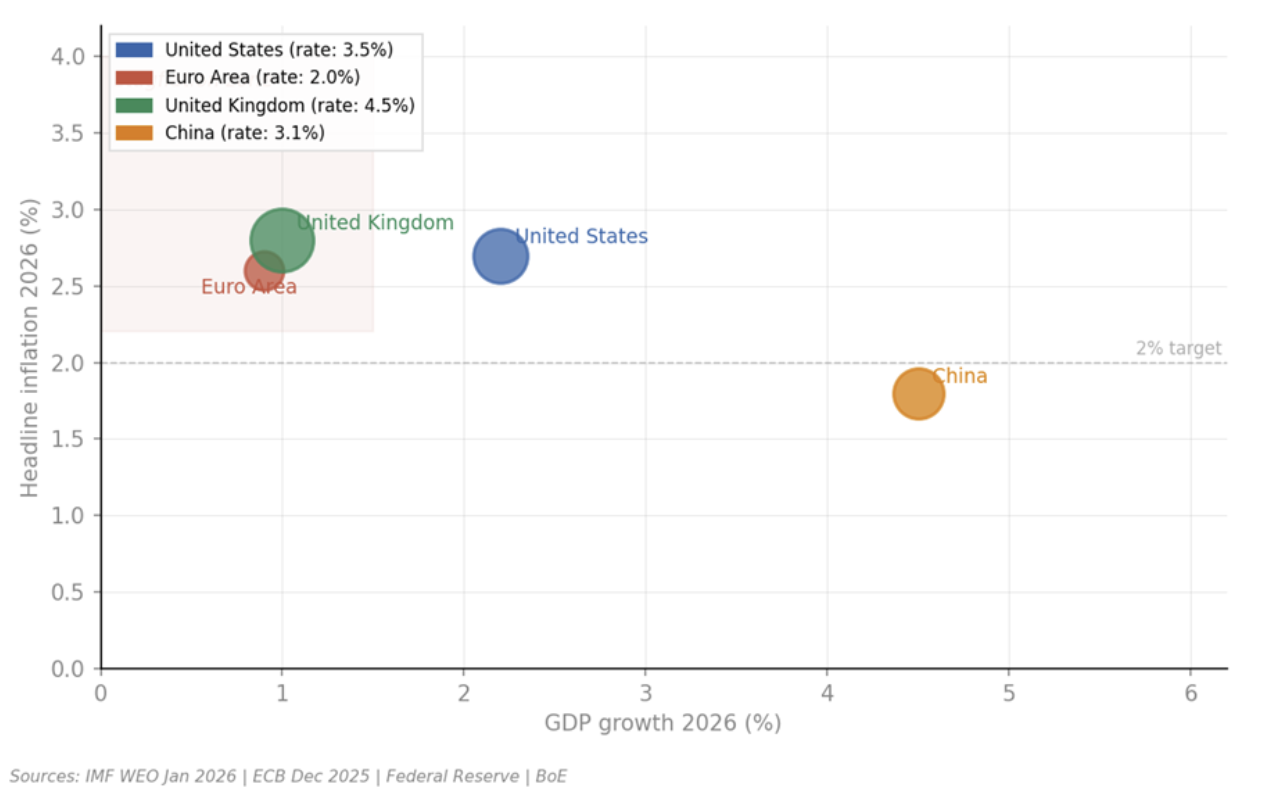
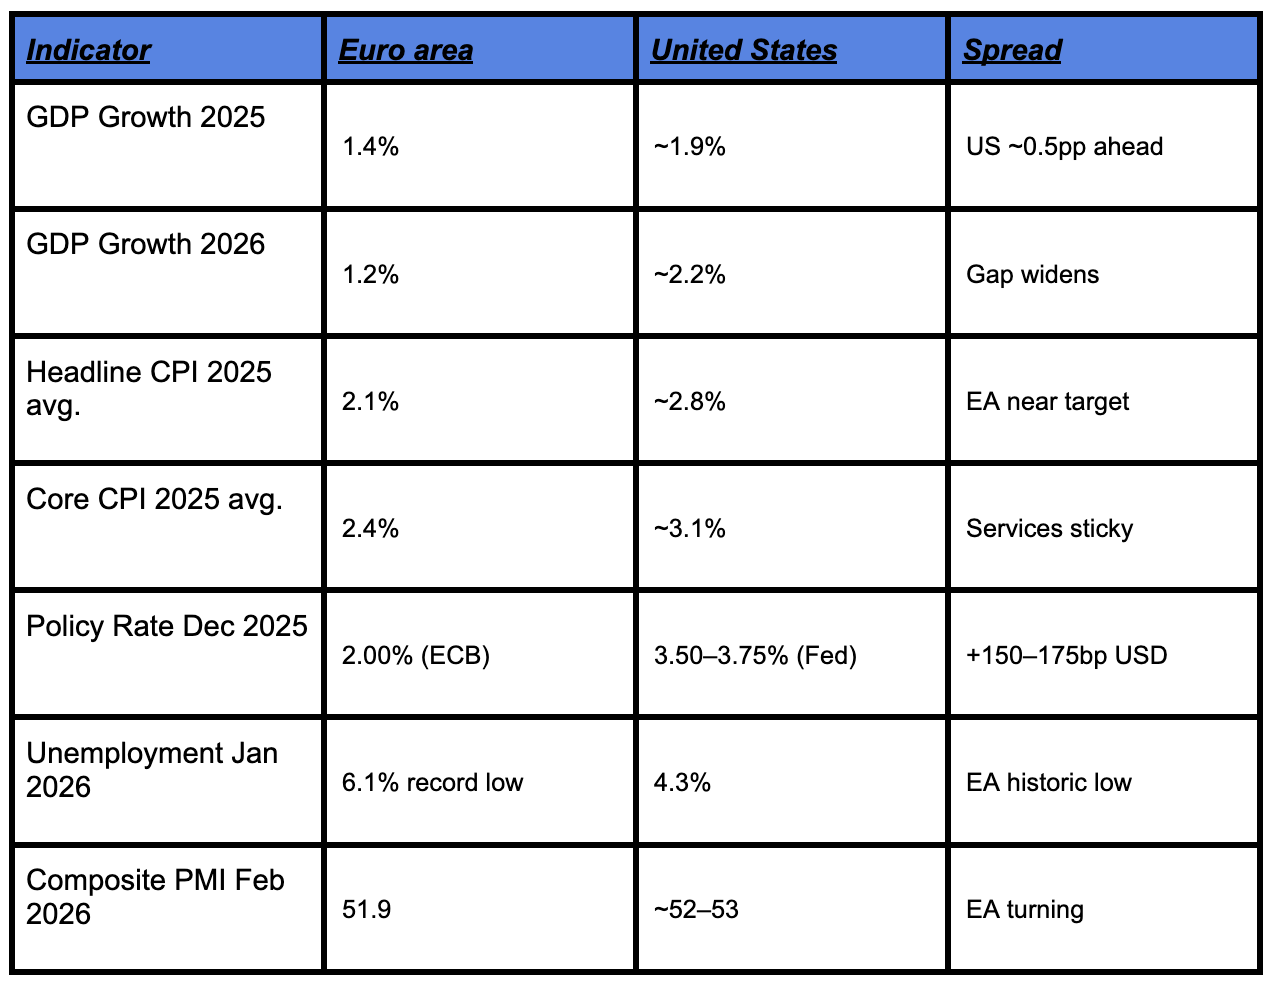
Table.1 - Macro Snapshot: Euro Area vs United States
The gap between US and European interest rates which sits currently at around 1.5 to 1.75 percentage points in the dollar’s favour is the single most important near-term driver of EUR/USD. Higher rates in the US attract more capital flows into dollar assets. Everything else is context. The ECB is also quietly unwinding its pandemic-era bond buying programme, gradually draining money from the banking system. This supports the dollar, which tends to benefit when financial conditions tighten globally.2) Historical analogues
The positive comparison is 2017-18, when EUR/USD rallied strongly as European growth closed the gap with the US. That closing of the gap was the key driver. It isn’t happening yet in 2026.The cautionary comparison is 2014-16, when EUR/USD fell hard as the ECB cut while the Fed hiked. Money flows toward higher interest rates and in that case, the dollar. If that divergence returns, the same thing happens. The period 2017-18 is the bull case for the EUR, and the period 2014-16 is the bear case. The question that is worth asking is will European growth close the gap with the U.S.?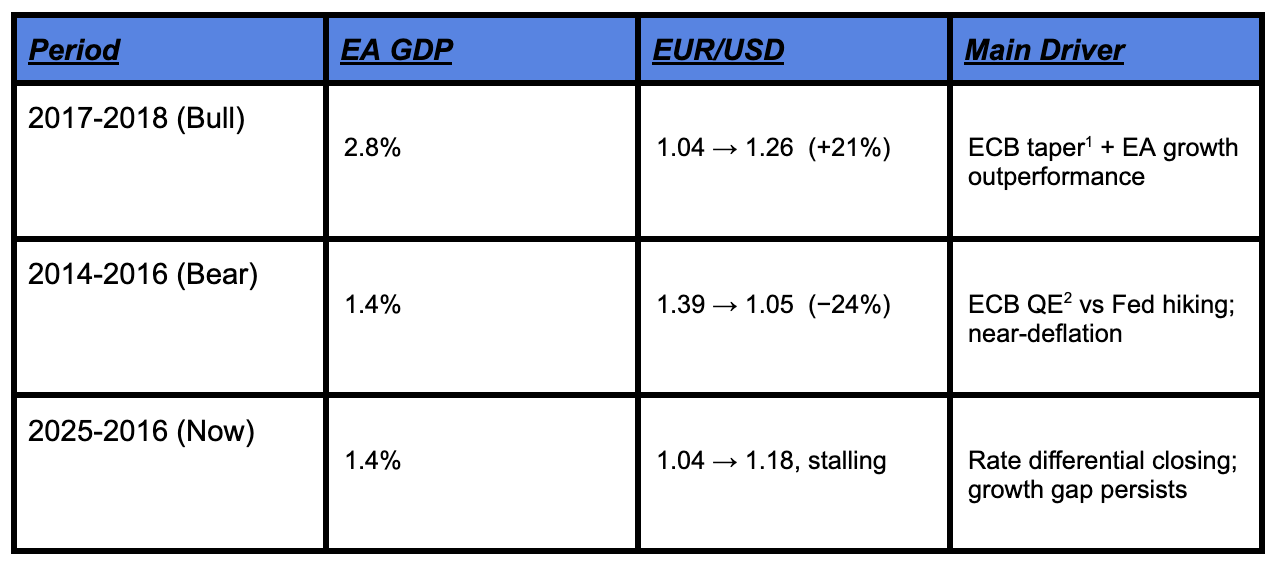
3) Constraints facing policymakers
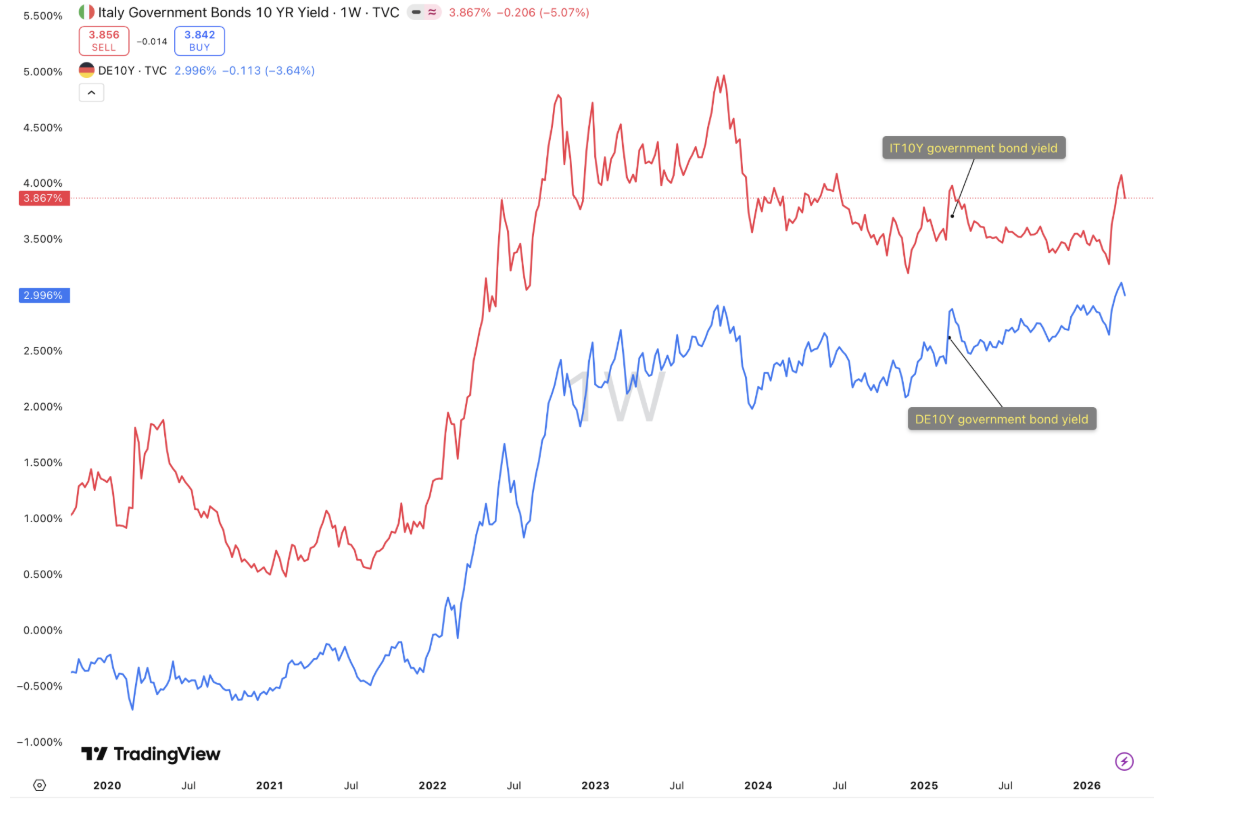
Three real constraints limit what policymakers can actually deliver. First, inflation credibility remains an issue. Services prices such as restaurants, travel, and rent are still above the ECB’s 2% target. At the same time, the ECB is already around what is considered a neutral rate, meaning policy is no longer clearly restrictive or supportive. Cutting rates further in this environment risks pushing inflation higher. Second, debt and deficits across the euro are rising, but unevenly, as can be seen from figure R. Germany still has room to increase spending, while countries like France and Italy are already stretched and face pressure from EU rules to reduce deficits. Germany retains fiscal space due to its relatively low debt burden and strong market credibility, allowing it to increase spending more easily than higher-debt countries such as Italy as can be seen from the graphs showing low debt to gdp ratio and low yields. This situation creates an uneven fiscal response across the region. Third, political fragmentation complicates implementation. Germany’s coalition is fragile, France is politically unstable, and EU-level rules create ongoing friction over how much governments can spend. As a result, there is a real risk that large policy announcements are made but not fully carried out, a gap that remains a recurring theme throughout this report.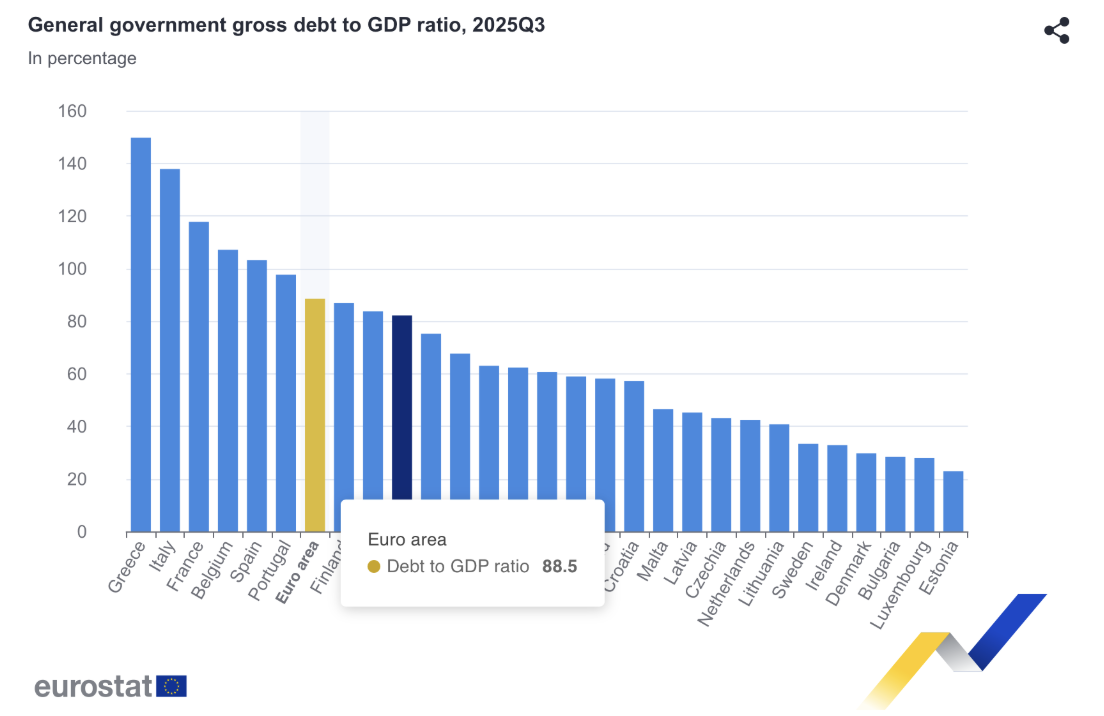
Figure R
The clearest near-term test of this is Germany. Friedrich Merz’s coalition has signalled a loosening of the constitutional debt brake, a shift that would have been politically unthinkable just two years ago. If fully implemented, the proposed increase in defence and infrastructure spending could provide a meaningful boost to the wider euro area economy. However, there are reasons for caution. Procurement systems are slow, defence spending takes time to translate into real economic activity, and markets have already priced in part of the expected fiscal expansion. The key question, therefore, is whether the actual outcome will match the political rhetoric.The Policy Backdrop:
This section sets out the monetary and fiscal context that directly shapes EUR/USD over the 2-6 month horizon. The central argument is simple: the rate differential is the dominant near-term driver, and it narrows only slowly - because the ECB is done cutting, while the Fed cuts modestly. Europe's fiscal pivot is real but slow to transmit. The result is a broadly range-bound EUR/USD rather than a decisive move in either direction.1) Current Macro Landscape
Both the ECB and Fed held rates at their March 2026 meetings. But the situations are different. The Fed holds because the economy is solid and inflation is sticky. The ECB holds because it is caught between an energy shock from the Middle East conflict and fragile growth - inflation revised sharply higher, growth revised down. That asymmetry is what matters for EUR/USD. The ECB cannot cut without risking inflation credibility. It cannot hike without crushing a fragile recovery. It is stuck - and that keeps the rate differential wide. 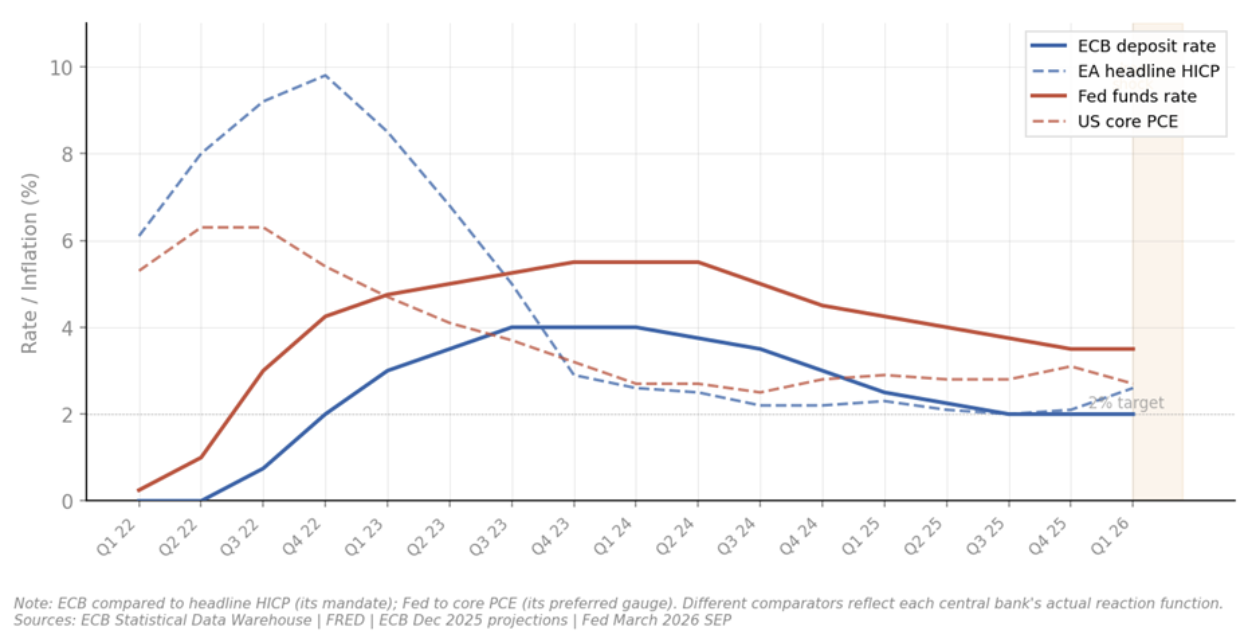
2) ECB Reaction Function
The ECB completed its cutting cycle in mid-2025 and has held every meeting since. The stance is neutral - neither stimulating nor restricting the economy. The bar to restart cuts is high: it would take a clear and sustained drop in services inflation. The bar to hike is also high: energy pass-through would need to become persistent and feed into wages. ECB Board member Schnabel has said she is comfortable with market expectations that the next move could be a hike. Specifically, the markets indicate an 84% probability of at least one ECB rate hike occurring sometime in 2026.Lagarde has kept all options open. For EUR/USD, this means the ECB is not the catalyst for the next move but the Fed. Services inflation is an important indicator. Below 3% reopens the door to cuts. Above 3.5% forces a hawkish reassessment and therefore a sharp EUR rally.3) Fed Reaction Function
The Fed is trying to satisfy a dual mandate: on one hand they need to combat inflation, which remains above target, as oil and energy prices are rising from the Middle East shock and on the other they want to maintain a healthy labour market. Recent U.S. labor market data show mixed signals as since May 2025, labour market data has become increasingly volatile, with job gains altering between negative and positive total nonfarm payrolls as can be seen from Figure X. Specifically, even though in February total nonfarm employment decreased by 133 thousand jobs, one of the highest monthly decreases ever since the COVID years, in March the U.S. economy added 178 thousand jobs, exceeding expectations of 65 thousand. Following the recent labor market data release, the markets favour a small chance that the Fed would raise interest rates this year.Nonetheless, even though at first glance the 178 thousand jobs added sounds like good news, if we look into each individual sector, we realise that the labour market data tell a different narrative. Even though net nonfarm payrolls have increased, the financial services as well as the information sectors have been steadily losing jobs, while sectors such as manufacturing, construction and leisure and hospitality have been gaining. This indicates that job growth is tilting toward lower-paying employment. Thus, it is very hard to conclude whether the U.S. labor market is heading toward the right direction.However, we can say that it does not yet show a clear deterioration, which means the Fed is unlikely to rush into cutting rates. At the same time, the lack of consistency in the data creates uncertainty around the outlook. 
An assessment of the Fed’s dual mandate does not currently support rate cuts. Inflation remains above target, while the labor market, although showing some volatility, has not weakened sufficiently to justify easing. Within this framework, the Fed’s reaction function does not yet point toward a shift in policy. However, changes in leadership may change the direction of the Fed’s policy. Powell's term ends in May. Kevin Warsh, Trump's nominee for Fed chair, has historically favoured higher interest rates, but now he is making a shift towards a more dovish stance because he argued that productivity gains from AI can help keep inflation in check. A more openly dovish Fed leadership could accelerate the easing timeline, compressing the rate differential faster than markets currently expect. An earlier-than-expected cut is the single biggest near-term upside catalyst for EUR/USD.Recent movements in US and Eurozone 2-year yields highlight a divergence between macroeconomic data and market pricing. As can be seen in Figure Y, the spread between US and German 2-year yields has been narrowing in recent weeks, indicating a reduction in the US rate advantage.This suggests that markets are already pricing a less restrictive relative policy stance in the US, even though incoming data does not yet clearly justify an imminent shift by the Fed. In this sense, rate differentials are beginning to move ahead of the macroeconomic backdrop, providing underlying support for EUR/USD. However, unless this compression continues or is validated by clearer signs of disinflation or labour market deterioration in the US, the upside in EUR/USD may remain limited.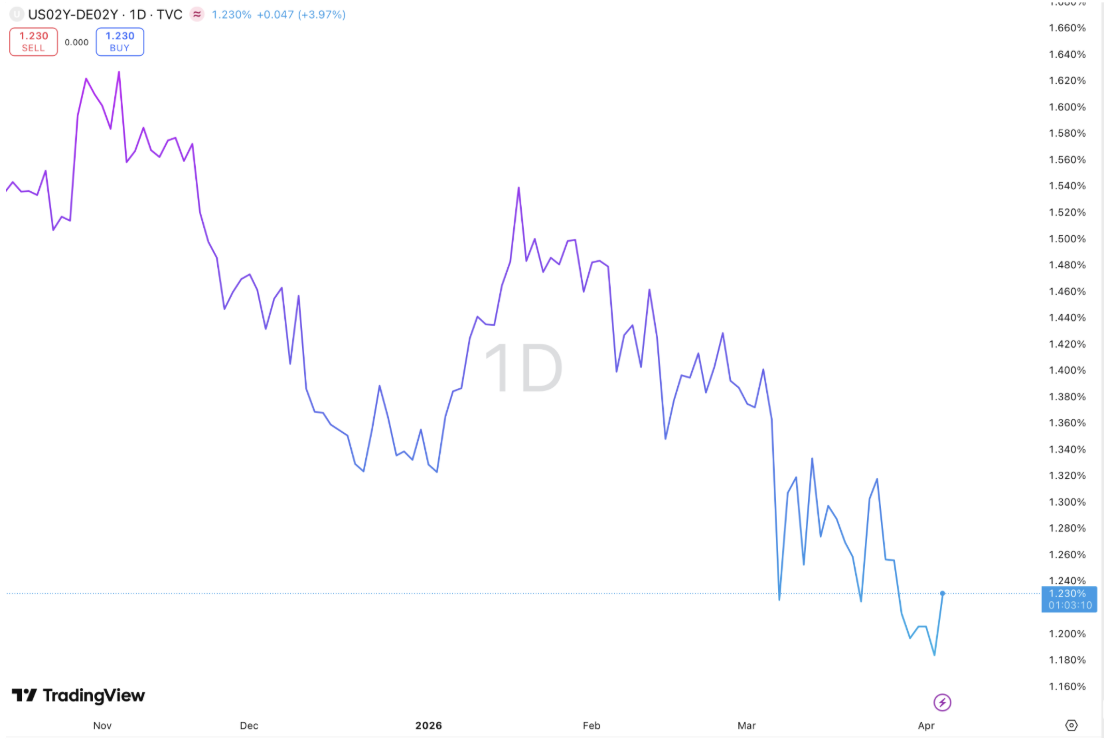
Figure Y
4) Fiscal & Political Overlay
Europe's fiscal pivot is the structural story of 2025–26, but it transmits slowly and unevenly.Germany is the anchor. Chancellor Merz pushed through a historic constitutional reform unlocking hundreds of billions in defence and infrastructure spending. On paper it is transformational. In practice, procurement is slow, defence contracts take years to flow through the economy, and the coalition has already shown internal friction.France is the risk. PM Lecornu passed a 2026 budget in February after months of political deadlock. The deficit remains nearly double the EU's 3% ceiling, and the political situation remains fragile. France has been a structural EUR headwind throughout this cycle.Italy missed its deficit target and public debt continues to rise. PM Meloni's room to expand spending is constrained by EU rules and elevated borrowing costs.The aggregate result: EU deficits are rising, but the net fiscal impulse to growth is broadly neutral. Germany's expansion is offset by consolidation elsewhere. The headline numbers look large. The macro transmission is modest. The fiscal pivot is being priced as a structural EUR positive. The execution risk is that it delivers less than promised - the same dynamic that defined the 2014-16 bear case.3. Market Analysis & Cross-Asset Implications
The structural backdrop is set - a growth gap not closing, a rate differential narrowing slowly, a fiscal pivot real but slow to transmit. This section focuses on where those themes are playing out in markets right now and where the asymmetries are building1) The Dollar: Cyclical Bounce Inside a Structural Downtrend
The DXY declined steadily from above 110 in early 2025 to a low of 96 in mid-February 2026 - consistent with rate differential compression. Since then it has bounced to around 100, driven almost entirely by safe-haven demand from the Iran conflict. That recovery is cyclical, not structural. The 100-101 level has acted as resistance multiple times since mid-2025. A failure to break above it confirms the range and the structural bear thesis. The US-EA 2-year rate spread has compressed from 200bp+ in late 2024 to around 150-175bp today - the direction is moving against the dollar even if the level still supports it. The Iran conflict has bought the dollar time. It has not changed the direction.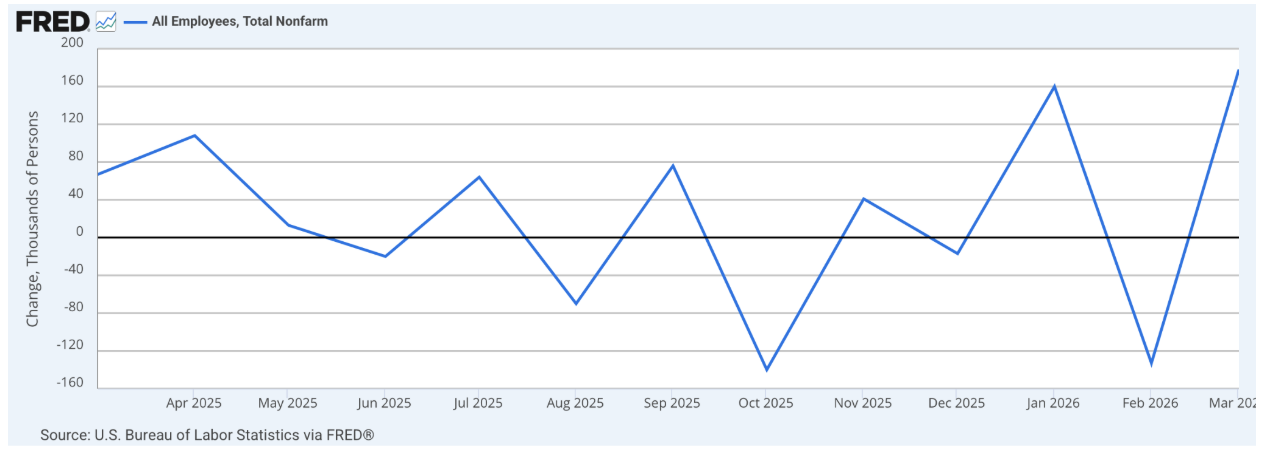
2) The Iran Conflict: Near-Term Dollar Support, Medium-Term Complication
US-Israel strikes on Iran on February 28 disrupted the Strait of Hormuz - through which roughly 20% of global oil flows - pushing Brent to around $105–115. The dollar benefited from both safe-haven demand and the inflation dynamic: Europe is far more exposed to energy import costs than the US, keeping the ECB stuck between inflation and weak growth. That asymmetry keeps the rate differential wide and caps EUR/USD near-term. But if the conflict de-escalates, the safe-haven premium fades rapidly. Morgan Stanley estimates real US consumption begins to decline two to three months after an energy price shock - bringing Fed cuts back into view and reversing the dollar's recent strength.→ section 1 and 2 talk about the DXY, similar theme, section 1 explains the movement section 2 explain why that is, maybe you can have both of these paragraphs under one section3) EUR/USD: Stalling at the Top of the Range
EUR/USD rallied from 1.04 in early 2025 to around 1.18 by late February 2026 on rate differential compression and fiscal pivot excitement. Since then it has pulled back toward 1.15. The fiscal pivot story has been priced. CFTC data shows EUR/USD net longs near multi-year highs - positioning this stretched raises the bar for further upside. Any disappointment on European delivery triggers a sharp unwind. The constraint is what Table 2 flagged. The 2017-18 bull analogue required European growth to close the gap with the US. That is not happening yet. Without convergence, EUR/USD consolidation in the 1.10-1.18 range is more likely than a sustained break higher. EUR/USD has priced the easy part. The next leg requires real economic delivery - not just spending announcements.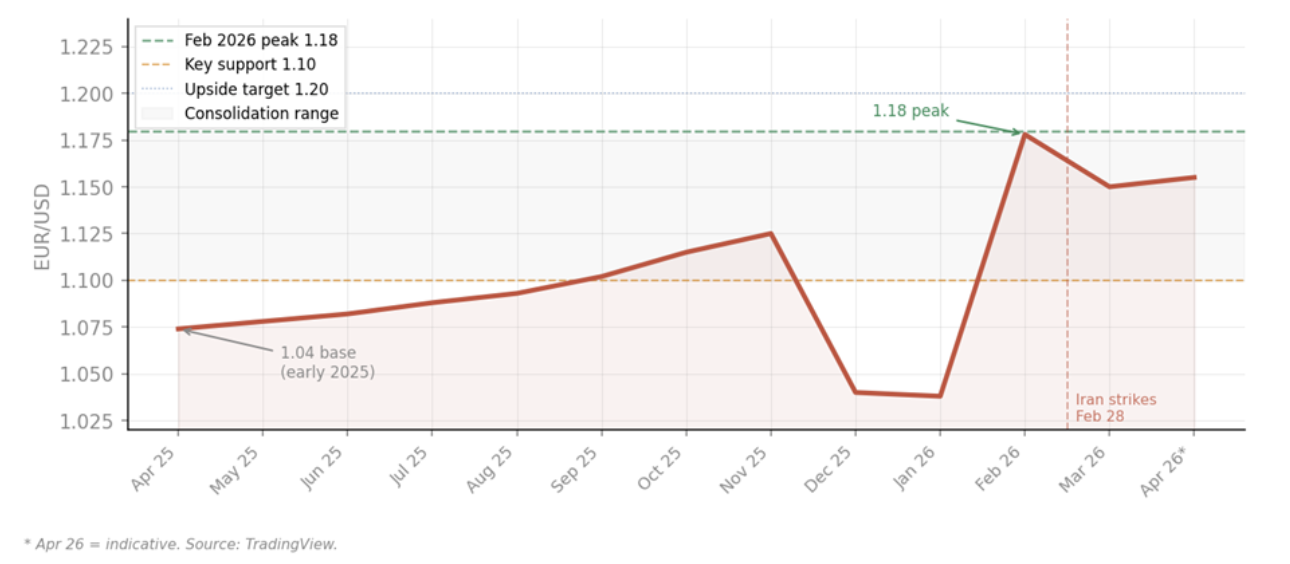
4) Rates and Positioning: The Signals to Watch
The US yield curve is bear steepening - 2s10s at +44bp, with long-end yields rising on fiscal concerns and Iran-driven inflation expectations. In the near term this attracts foreign capital and supports the dollar. Medium term, persistent bear steepening historically accompanies fiscal stress not constructive for the dollar over a 2-6 month horizon. VIX at 27–31 is elevated. Gold holding above $4,400 after a multi-year rally signals real-asset safe-haven demand and reserve diversification away from dollar assets. The two together - dollar and gold both bid - tell you different investors are pricing different risks simultaneously. That is not a stable equilibrium. The asymmetry is clear. Near term, crowded EUR longs and Iran-driven dollar demand cap EUR/USD upside. An earlier-than-expected Fed cut remains the single biggest medium-term upside catalyst - compressing the rate differential rapidly and likely pushing EUR/USD through 1.20 in a short window. Near term: Iran and positioning keep EUR/USD capped. Medium term: the structural trend reasserts once the geopolitical premium fades.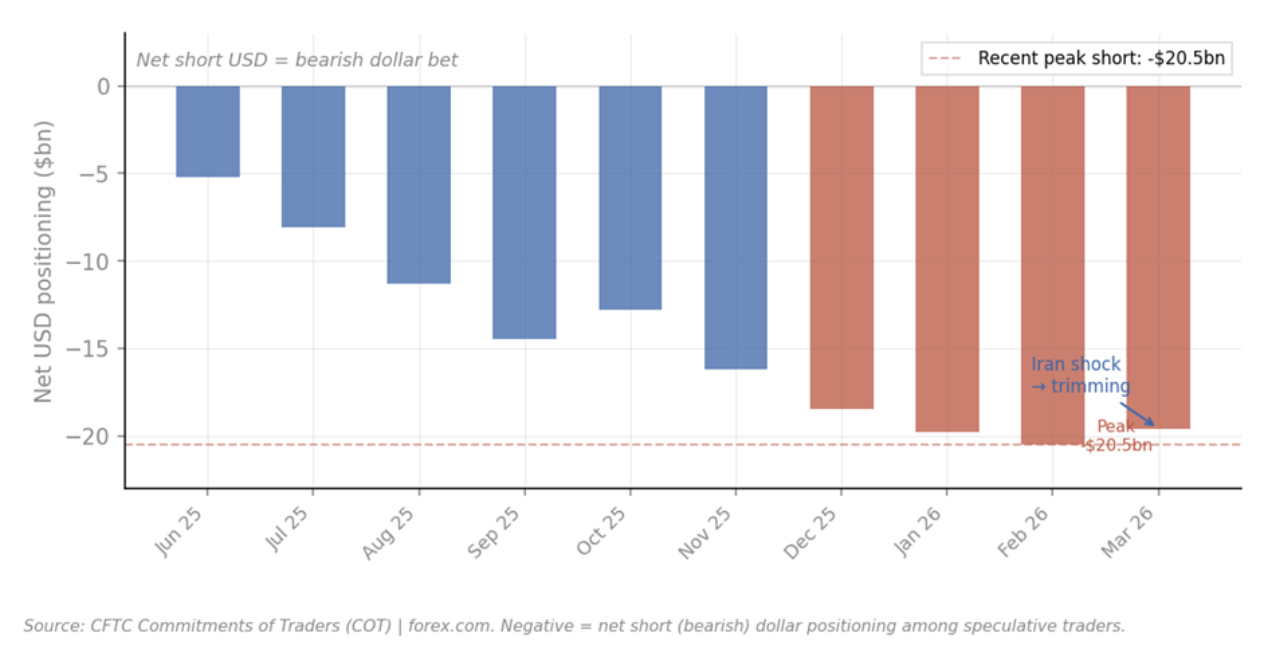
4. Forward-Looking Scenario Analysis (2–6 Month Horizon)
The analysis in the previous sections points to a dollar that is range-bound near term, with a structural bias toward depreciation as the year progresses. The key variables are the Iran conflict duration, the Fed's easing timeline, and whether European fiscal delivery matches the rhetoric. Three scenarios follow.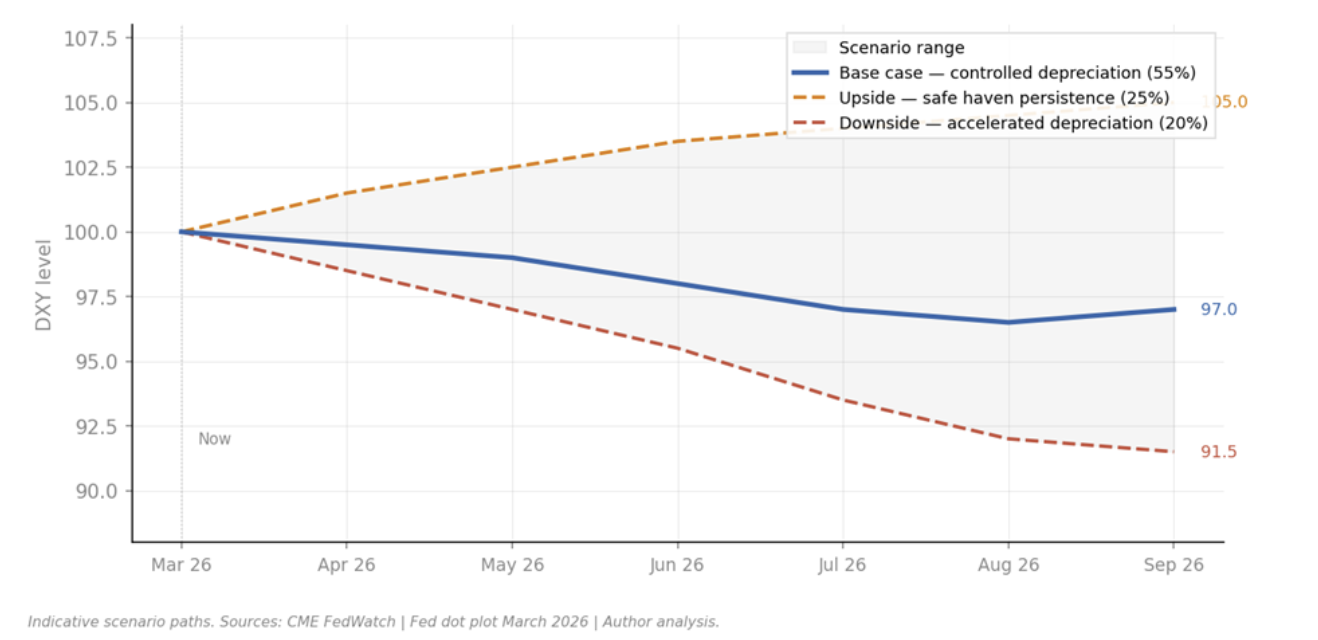
Base Case — Controlled Depreciation (Probability: ~55%)
The Iran conflict moves toward a negotiated resolution within the next four to eight weeks. Oil prices ease from current levels, the safe-haven dollar premium fades, and the Fed resumes its cutting cycle — most likely one 25bp cut in September or December, in line with the dot plot median. Core PCE edges down gradually as energy pass-through fades and labour market softening reduces wage pressure.In this scenario the DXY drifts lower toward the 95–99 range by Q3 2026, as the rate differential continues to compress and twin deficit concerns reassert themselves. EUR/USD recovers toward 1.18–1.22 as the dollar safe-haven bid unwinds and European growth data begins to show the first traces of German fiscal impulse. Positioning unwinds cleanly — crowded EUR longs are absorbed by improving fundamentals rather than forced by a shock.This is not a dollar collapse. It is a gradual, orderly depreciation consistent with the structural forces identified throughout this report — narrowing rate differentials, widening twin deficits, and a Fed transitioning from a hawkish hold to a modest easing bias.→ DXY target: 95–99 by Q3 2026. EUR/USD target: 1.18–1.22.Upside Scenario — Safe Haven Persistence (Probability: ~25%)
The Iran conflict escalates materially — Strait of Hormuz remains functionally closed beyond April, oil sustains above $120, and second-round inflation effects begin to show up in services CPI. The Fed is forced to abandon its single cut projection and signal no easing in 2026. Markets price in a rate hike by December — a scenario that would be highly supportive of the dollar.In this environment, DXY holds above 100 and potentially tests 103–105. EUR/USD breaks below 1.10 as the ECB faces its own stagflationary bind, unable to cut without reigniting inflation and unable to hike without crushing growth. The 2014–16 bear analogue becomes more relevant — Europe is squeezed by energy costs while the US retains its rate advantage. Equities sell off globally, reinforcing dollar safe-haven demand in a self-reinforcing loop.The key trigger to watch: whether tanker traffic through the Strait normalises after Trump's current ceasefire deadline. If it does not, this scenario becomes the base case.→ DXY target: 103–105. EUR/USD target: 1.05–1.10.Downside Scenario — Accelerated Dollar Depreciation (Probability: ~20%)
The conflict resolves quickly, oil retraces sharply toward $75–80, and the inflation overshoot proves transitory. With energy prices falling and labour market softening accelerating, the Fed cuts twice in 2026 — sooner and faster than the dot plot implies. Simultaneously, Warsh is confirmed and signals a dovish pivot on rates alongside balance sheet tightening, which steepens the curve and signals to markets that the Fed's real yield advantage is structurally eroding.Add to this any further deterioration in US fiscal credibility — a failed Treasury auction, another credit downgrade, or a political deadlock over the debt ceiling — and the conditions for a sharp dollar move lower are in place. DXY breaks below 95 and potentially tests 90–93, levels not seen since 2020–21. EUR/USD pushes above 1.25 as European fiscal delivery and rate convergence accelerate the structural re-rating.This scenario does not require a crisis. It only requires the soft data — labour market, consumer confidence, forward orders — to deteriorate faster than the inflation data improves, forcing the Fed's hand.→ DXY target: 90–93. EUR/USD target: 1.22–1.28.Chart: DXY scenario path — three-scenario fan chart with base/upside/downside ranges — TradingView / CME FedWatch5. Key Catalysts & Timeline
The following events and data releases will be the most important inputs to watch over the 2–6 month horizon.Central bank meetings. The next FOMC meeting is April 29–30. Markets are pricing a 95% probability of a hold — the question is the tone of the statement and whether Powell signals any shift in the energy inflation assessment. The May transition to Warsh — if confirmed — is the single biggest institutional wildcard of the period. The ECB meets again in April and June; watch for any shift in language around services inflation or the Iran energy shock.Geopolitical developments. The Strait of Hormuz is the dominant near-term variable. Trump has extended ceasefire deadlines but Iran has rejected proposals. A resolution removes the safe-haven dollar bid rapidly. An escalation — particularly any move to target Iranian energy infrastructure at Kharg Island — would push oil toward $130–150 and lock in the upside scenario.Data releases. Core PCE in April will be the first clean read on whether the Iran energy shock is feeding into broader prices. Non-farm payrolls in April and May will determine whether the labour market deterioration is accelerating — the trigger for earlier Fed cuts. Watch the PPI-PCE spread: if it continues to narrow, upstream cost pressures are passing through to consumers, which is stagflationary and dollar-complicated.Warsh confirmation. Senator Tillis has vowed to block any Fed nominee until the DOJ resolves its investigation into Powell. If confirmation stalls past May, the Fed enters a period of institutional ambiguity that complicates forward guidance and adds uncertainty premium to dollar positioning.Risks to the thesis. The primary risk to the structural dollar bear case is a sustained Iran escalation that keeps oil above $120 for more than two months — forcing the Fed to abandon its easing bias entirely. The secondary risk is that European fiscal delivery disappoints materially — procurement delays, coalition friction in Germany, or a fresh French political crisis — removing the structural EUR support that the market has been pricing. A third risk is de-dollarisation accelerating beyond the 2–6 month horizon: central banks continuing to trim Treasury holdings would add structural pressure, but this is unlikely to be a near-term market mover.6. Concluding Takeaway
The dollar is not in freefall. But the structural supports that sustained it through 2023–24 — a real yield premium of 200bp+, US growth exceptionalism, and aggressive Fed tightening — are gradually eroding. The rate differential is compressing. The twin deficits are widening. The Fed is transitioning from hawkish hold to modest easing. These forces do not produce sudden moves. They produce slow, persistent pressure that compounds over months.What the Iran conflict has done is interrupt that process — not reverse it. The safe-haven bid is real, and while the Strait of Hormuz remains disrupted, it provides genuine near-term dollar support. But geopolitical risk premia fade. They always have. When this one fades, the structural forces reassert themselves.The thesis of this report is straightforward: the dollar is entering a multi-quarter depreciation cycle, interrupted but not derailed by geopolitical noise. The base case places DXY at 95–99 by Q3 2026, with risk skewed to the downside from H2 onward if the Iran conflict resolves and the Fed resumes cutting. EUR/USD recovers toward 1.18–1.22 in the base case — not a structural re-rating of Europe, but a normalisation of a rate differential that had been stretched too far in the dollar's favour.The market behaviour to expect is not a trend — it is a regime of elevated volatility and range-trading, punctuated by sharp directional moves when the dominant variable shifts. Near term that variable is Iran. Medium term it is the Fed's easing timeline. Investors who try to trade every headline will be whipsawed. Those who stay anchored to the structural thesis — compressing differentials, widening deficits, eroding real yield advantage — will be positioned correctly for the move when it comes.Final thought. The dollar's reserve currency status is not in question over a 2–6 month horizon. What is in question is the price at which that status is priced. Over the next cycle, markets will reward those who understand the difference between cyclical dollar strength and structural dollar durability — and recognise that right now, the former is masking the erosion of the latter.Sources
· ECB Monetary Policy Decision, March 2026 — https://www.ecb.europa.eu/press/pr/date/2026/html/ecb.mp260319~3057739775.en.html
· ECB Monetary Policy Decision, December 2025 — https://www.ecb.europa.eu/press/pr/date/2025/html/ecb.mp251218~58b0e415a6.en.html
· Fed FOMC Decision, March 2026 — https://www.cnbc.com/2026/03/18/fed-interest-rate-decision-march-2026.html
· European Commission Autumn 2025 Economic Forecast — https://economy-finance.ec.europa.eu/economic-forecast-and-surveys/economic-forecasts/
· European Commission — France Economic Forecast — https://economy-finance.ec.europa.eu/economic-surveillance-eu-member-states/country-pages/france/
· European Commission — Germany Economic Forecast — https://economy-finance.ec.europa.eu/economic-surveillance-eu-member-states/country-pages/germany/
· Italy misses 2025 deficit target — Reuters / Yahoo Finance — https://ca.finance.yahoo.com/news/italy-misses-2025-deficit-debt-114230665.html
· Germany coalition agreement and debt brake reform — Jacques Delors Centre — https://www.delorscentre.eu/en/publications/
· CFTC FX Futures Positioning — forex.com — https://www.forex.com/en-us/news-and-analysis/fx-futures-positioning-us-dollar-eur-usd-gbp-usd-cot-report/
· IEA Oil Market Report March 2026 — https://www.iea.org/reports/oil-market-report-march-2026
· Morgan Stanley: Iran Conflict Oil & Inflation — https://www.morganstanley.com/insights/articles/iran-war-oil-inflation-stock-market-2026
· Macrotrends EUR/USD Historical — https://www.macrotrends.net/2548/euro-dollar-exchange-rate-historical-chart
· CME FedWatch Tool — https://www.cmegroup.com/markets/interest-rates/cme-fedwatch-tool.html
· FRED Economic Data — https://fred.stlouisfed.org
· TradingView Charts — https://www.tradingview.com