
USD: Is the Dollar entering a multi-quarter depreciation cycle?
Executive Summary
The USD stands at a structural inflection point. After markets entered 2026 pricing with multiple rate cuts, expectations have been sharply pared back as persistent inflation, weak labour data and geopolitical uncertainty have complicated the Fed's trajectory. The debate has shifted from how fast the Fed will ease to whether it can ease at all this year, and hence whether the dollar is entering a broader multi-quarter depreciation cycle or merely consolidating before resuming its decline.
After three consecutive 25 bp rate cuts in late 2025, the Federal Reserve has held rates steady at 3.50-3.75% for two consecutive meetings in January and March 2026, pausing its easing cycle just as the macroeconomic environment has become materially more volatile. What has changed is not simply the direction of growth data, but the nature of the policy trade-off itself. Core PCE has re-accelerated to 3.1% YoY as of January 2026, the highest in nearly two years, even as nonfarm payrolls recorded their second largest decline since December 2020, falling by 92,000 in February 2026. The unemployment rate has risen to 4.4% as of February 2026, its highest level since 2021.
Adding to the stagflation narrative, PPI printed 0.7% MoM and 3.4% YoY, while core PPI hit 3.9% as of February 2026. With core PCE at 3.1% YoY, the spread to core PPI is nearly a full percentage point, signalling that upstream price pressures have not yet fully transmitted to the consumer level. Historically, this gap closes either through rising consumer prices or employment cuts as firms move to protect margins. Both outcomes suggest stagflation.
Simultaneously, the US-Iran conflict has pushed Brent crude to approximately $105 per barrel in March, whipsawing on ceasefire hopes and escalation fears, injecting a supply-side inflation shock into a market already managing significant tariff-induced price pressures. As for gold, it has corrected approximately 15% from its peak above $5,170 to roughly $4,400, and the fact that both gold and the dollar are weakening simultaneously, breaking their traditional inverse relationship, suggests a broader rotation out of dollar-denominated safe havens that warrants close monitoring.
Core Thesis: Our base case places the DXY at 95-97 by Q3 2026, with risk skewed to the downside from H2 onward. The dollar's structural supports, including real yield premium, rate differentials and overall safe-haven demand, are gradually eroding but likely to remain intact in the near term. To transition from cyclical strength to structural depreciation, there would need to be a decisive narrowing of US-G10 rate spreads or a loss of inflation credibility, and neither condition is yet met, but the runway is shortening.
Moving forward, this report examines three key questions: whether the Fed's reaction function can navigate the stagflation bind revealed by the PPI-PCE divergence, whether compressing real yield differentials and widening twin deficits are sufficient to initiate a structural USD downcycle, and whether geopolitical risk premia from the Iran conflict will sustain or erode dollar demand. We also assess the implications of the Warsh nomination, the SOFR-SORA basis as a funding stress signal. Lastly, we conclude by constructing scenario analysis for the DXY over the next six months.
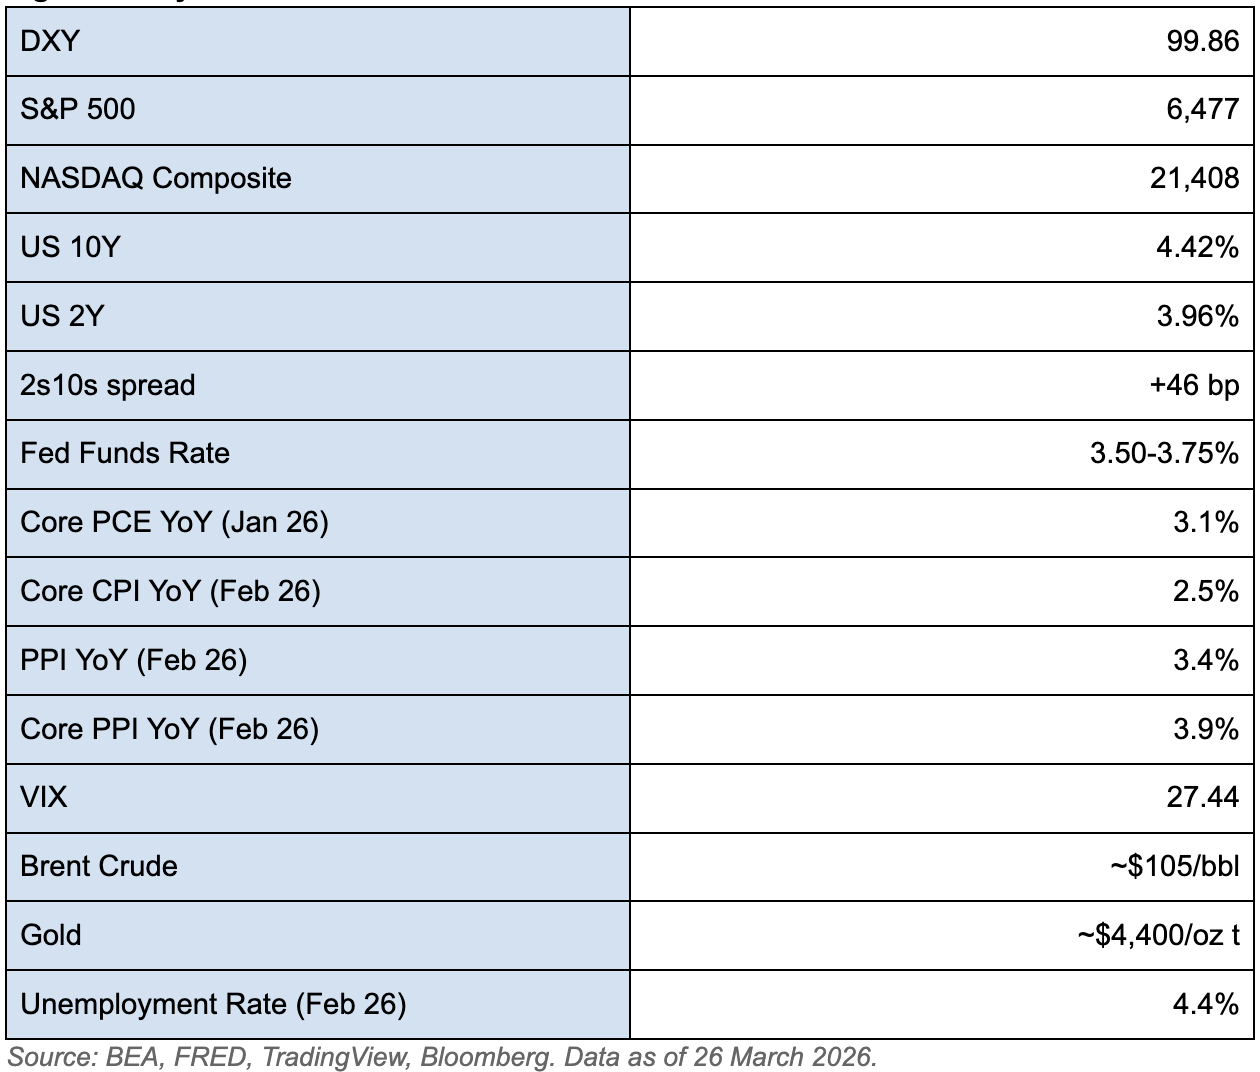
Figure 1: Key Market Levels
1. The Policy Backdrop
Currently, the macroeconomic environment is defined by a paralysed Fed, an impending leadership transition, and a deteriorating fiscal position at a pace inconsistent with the long-term stability of the dollar.
1.1 Monetary Policy: The Fed’s Reaction Function
On March 18, 2026, the FOMC voted 11-1 to hold the federal funds rate steady at 3.50–3.75%, unchanged since December 2025. The decision was made amid pressure from President Trump to lower rates and a rising inflationary threat from the oil shock caused by disruptions in the Strait of Hormuz. The March dot plot maintains a median projection of one 25 bp rate cut in 2026, unchanged from December. However, the committee has shifted to a more hawkish stance, with seven of nineteen participants now expecting no cuts at all in 2026, up from six in December.
Data: Fed holds at 3.50-3.75%. Real policy rate (FFR - Core PCE) approximately +40-65 bp. Median dot: one cut in 2026 and another in 2027. 7/19 officials expect zero rate cuts in 2026. March 2026 FOMC vote: 11-1.
Meaning: The Fed is effectively paralysed, unable to cut rates due to sticky inflation and unwilling to hike amid a weakening labour market. This is a classic late-cycle bind where the range of available policy responses narrows considerably. The real policy rate of +40-65 bp is modestly restrictive, but far less so than the +200 bp that prevailed at peak tightness in late 2023.
Significance: In 2023, the high real rate was a massive dollar support; investors were paid 2%+ above inflation to hold dollars. Today, at +40-65 bp, that yield advantage has shrunk dramatically, contributing to the DXY's decline from 110 to below 100. However, because the Fed remains on hold, rate differentials versus other currencies are compressing more slowly than the market expects. This keeps the dollar's yield advantage intact in the near term, delaying the structural depreciation of USD.
Impact: The DXY's resilience around 99-100 despite weakening fundamentals reflects this policy gridlock. The dollar will remain range-bound until the Fed is forced to act either by further labour market deterioration (which will lead to weakening USD, assuming rate cuts follow) or by de-escalation in geopolitical tensions that removes the inflation overshoot (which will also lead to weakening USD, as safe-haven demand fades).
1.2 A Warsh Era: Regime Change at the Fed
Data: With Jerome Powell's term as Fed Chair expiring on May 15, 2026, the Fed faces a potential leadership transition. President Trump nominated Kevin Warsh on January 30, 2026, and formally transmitted the nomination to the Senate on March 4. However, Senator Tillis has vowed to block confirmation of any Fed nominee until the DOJ resolves its investigation into whether Powell misrepresented the costs of a $2.5 billion renovation of the Federal Reserve's headquarters to Congress. Powell has stated he will not leave the Board of Governors until the investigation is resolved and a successor is confirmed, creating the possibility of an extended interim period beyond May.
Warsh served as a Fed Governor from 2006 to 2011, where he acted as the central bank's primary liaison to Wall Street during the 2008 financial crisis. His policy record is historically hawkish. He publicly expressed strong reservations about the Fed's $600 billion bond-purchase programme (QE2) in 2010 and published a Wall Street Journal op-ed outlining his concerns about misallocation of capital. However, in the context of his current nomination, he has adopted a more nuanced stance, arguing that AI-driven productivity gains are structurally disinflationary and can support lower rates without reigniting price pressures.
Meaning: The Fed therefore faces a potential leadership vacuum. If Warsh’s confirmation stalls, which is increasingly likely given Tillis’s blockade and the ongoing DOJ appeal, Powell may serve in an interim capacity beyond May, creating institutional ambiguity that complicates forward guidance for the markets.
Significance: The potential leadership transition matters for the dollar, as Powell and Warsh represent contrasting policy frameworks. Powell is a data-dependent pragmatist. He is moderately hawkish in the current environment, holding rates despite Trump’s pressure, but willing to cut aggressively when the data supports it, as seen with the three consecutive cuts in late 2024. On the other hand, Warsh is hawkish on balance sheet management but pragmatically open to rate cuts. His core priority is balance sheet discipline. He is skeptical of the Fed holding trillions in assets and would likely accelerate quantitative tightening through active MBS sales rather than passive runoff. This combination of balance sheet hawkishness with rate flexibility represents a fundamentally different policy mix from Powell, with direct implications for the yield curve and dollar positioning.
Impact: Near-term (March-May 2026), confirmation uncertainty regarding regime change at the Fed is a source of policy ambiguity, and investors cannot position for a clear Fed direction. Medium-term (H2 2026), Warsh's policy actions on balance sheet management will be a key directional driver for the dollar. If Warsh were to be the next Fed Chair, he would likely cut short-term rates while actively selling MBS, steepening the yield curve sharply. Although this initially supports the dollar as higher long-end yields attract foreign capital, weakening is likely to follow: a steeper curve signals growing inflation or deteriorating fiscal sustainability ahead, neither of which is constructive for the dollar.
1.3 Fiscal Overlay: Twin Deficits and the Refinancing Wall
US national debt surpassed $39 trillion for the first time in March 2026, and the Congressional Budget Office projects the federal deficit at $1.9 trillion for FY2026, with debt held by the public rising from 101% of GDP today to 120% by 2036. Additionally, account deficit was reported at 2.4% of GDP in Q4. Together, these twin deficits, both fiscal and external, have historically correlated with periods of sustained dollar weakness when they coincide with a turning rate cycle.
Data: Federal deficit $1.9 trillion (FY2026). National debt >$39 trillion. Debt-to-GDP at 101%, projected 120% by 2036. Current account deficit 2.4% of GDP. ~$9 trillion of Treasuries need refinancing by end-2026. Moody's downgraded US credit to Aa1. Net interest on government debt is projected to reach $1 trillion in FY2026, nearly triple the $345 billion paid in 2020.
Meaning: The US is borrowing at an unsustainable pace during a period when it should theoretically be reducing deficits, particularly with approximately $9 trillion of Treasuries maturing and a softening labour market that may further reduce tax revenues. The Moody’s downgrade, the last major agency to strip the US of its top rating, signals that even rating agencies view the debt trajectory as unsustainable.
Historical Context: During the 2002-2008 dollar depreciation cycle, the DXY declined approximately 40% as the US ran large twin deficits while the Fed eased. The current configuration of widening fiscal deficits, a nascent easing cycle, and gradually compressing rate differentials shares structural similarities with that period.
Significance: The fiscal deterioration is the slow-burn structural driver of dollar weakness. Although it does not produce sudden moves, it steadily erodes the dollar’s real purchasing power, making the US increasingly dependent on foreign capital inflows to fund its deficits. This dependency is compounded by a gradual erosion of the dollar's reserve share, which has declined from approximately 66% in 2015 to around 57% as of Q3 2025 per IMF COFER data, as central banks, particularly across the BRICS grouping, have diversified into gold and alternative stores of value since the weaponisation of Russian reserves in 2022.
Impact: Rising long-end yields make it more expensive for the US to refinance its maturing debt, while central banks globally have been trimming Treasury holdings. The fiscal trajectory is clearly unsustainable, and the market is pricing this through rising term premium as investors demand extra compensation for the risk of holding long-term US debt rather than outright selling. For the dollar, this means gradual structural pressure rather than a sudden collapse.
2. Framing the Macro Regime
The current regime can be characterised as a late-cycle soft landing under stress. Growth is moderating but not collapsing, inflation is cooling on CPI but re-accelerating on the Fed’s preferred PCE gauge, and real yields remain elevated despite 175 basis points of cumulative easing since September 2024.
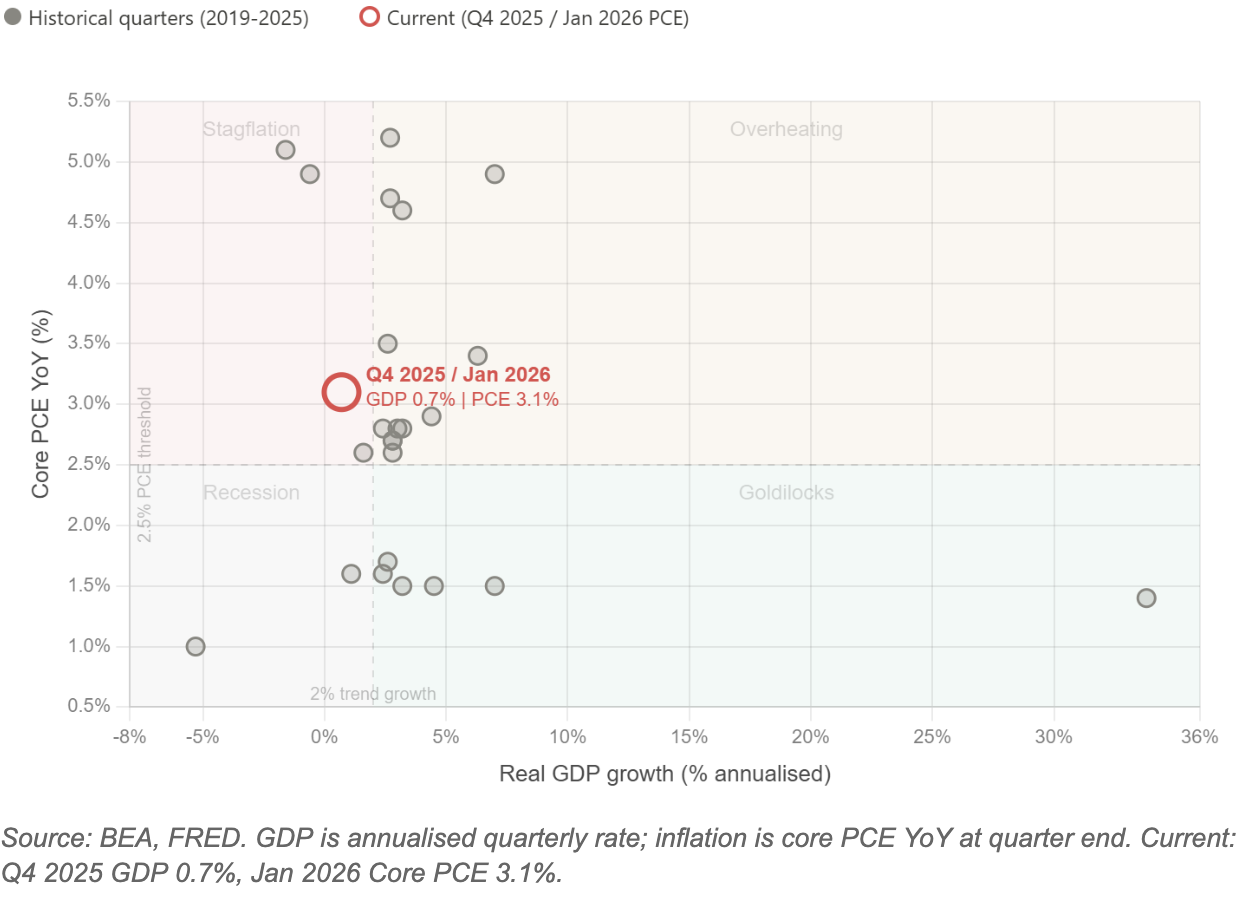
Figure 2: Growth-Inflation Regime Map (2019-Present)
The US economy expanded at a 0.7% annualised rate in Q4 2025, the weakest performance since a contraction in Q1 2025. Although the Fed’s March 2026 SEP projects 2.4% real GDP growth for 2026, a slight upward revision from December’s 2.3%, the Q4 weakness, driven by downward revisions to exports, consumer spending, government spending and business investment, suggests downside risk to that forecast.
2.1 Stagflation Risk: The PPI-PCE Transmission
Data: The PPI data tells a story that has not yet fully transmitted to market pricing. PPI printed 0.7% MoM in February 2026, the hottest monthly reading in a year. Core PPI at 3.9% YoY is running nearly a full percentage point above core PCE at 3.1%.
Meaning: PPI measures what businesses pay for inputs. When PPI runs significantly above PCE, it signals that businesses are absorbing cost increases through margin compression rather than passing them on to consumers. However, this is unsustainable, and eventually firms either raise consumer prices, pushing PCE higher, or cut employment to further protect margins, pushing unemployment higher. Both outcomes are stagflationary.
Adding to this, the current Iran oil shock and tariff pass-through further feed into producer prices. Elevated tariff revenue confirms that a significant volume of imports continue to flow through tariffed channels, meaning these cost pressures are feeding directly into PPI and will eventually reach consumers via PCE.
A further critical nuance is the widening gap between core CPI (2.5% YoY, stable) and core PCE (3.1% YoY, rising). This divergence matters because the Fed targets PCE, not CPI. Portfolio management fees, airfares and financial services components carry greater weight in the PCE basket, and these are precisely the categories experiencing persistent inflation. Investors watching CPI alone are receiving a misleadingly benign inflation signal; on the gauge the Fed actually targets, price pressures are intensifying.
Historical Context: A similar PPI-PCE gap emerged in 2021-2022 before consumer inflation subsequently surged. The current gap suggests the worst of the inflation pass-through may still be ahead.
Significance: The PPI data suggests that the Fed’s inflation problem is not over and is merely delayed. The 0.7% MoM PPI reading, if sustained, implies an annualised pace far exceeding the Fed’s 2% target. The upcoming February core PCE release on April 9 will be a critical test of whether this pipeline pressure is beginning to reach consumers.
Impact: The PPI-PCE gap places the Fed in a lose-lose position: cutting rates validates the stagflation thesis and weakens the dollar through lower nominal yields, while holding rates allows the growth slowdown to deepen until the labour market deterioration forces even deeper cuts. Either path leads to a weaker dollar; the question is timing. The market has not fully priced this asymmetry, with the median dot still projecting only one cut.
2.2 Labour Market: A Stalling Engine
The February 2026 employment report was a jolt. Nonfarm payrolls fell by 92,000 against consensus expectations for a 59,000 job gain. December and January were revised down to -17,000 and 126,000 respectively. Over the trailing three months, the economy has averaged a net gain of just 6,000 jobs per month, effectively stall speed.
Data: NFP: -92,000 (February 2026). Unemployment rate: 4.4% (February 2026). 3M average job gains: ~+6,000/month. Average hourly earnings: 3.8% YoY.
Meaning: The labour market is not collapsing but it has stopped growing. Firms are neither hiring nor engaging in broad-based layoffs, a pattern consistent with late-cycle deceleration rather than recessionary contraction. However, average hourly earnings remain firm at 3.8% YoY despite the payroll weakness, suggesting that wage pressures persist even as hiring stalls. This complicates the Fed’s calculus, as sticky wages feed into services inflation, reinforcing the case against rate cuts.
Significance: Any single month of NFP can be distorted by revisions, but the 3M average of approximately +6,000 jobs per month strips out that noise. With a rising unemployment rate, the economy is thus creating far fewer jobs than needed to absorb new entrants to the workforce.
Impact: A stalling labour market that nonetheless generates sticky wage growth is the worst combination for the dollar. It gives the Fed no clean trajectory: wages are too strong to justify cutting, but hiring is too weak to justify holding. The dollar will remain range-bound for as long as this tension persists. However, with GDP at 0.7% and the 3M job average at stall speed, the balance of risk is that hiring deteriorates further, tipping the Fed towards cuts and the dollar towards weakness.
3. Market Analysis: Structural Drivers and Cross-Asset Implications
The policy constraints and macro regime established in Sections 1 and 2 now transmit into market prices. This section identifies where current pricing is inconsistent with those signals, structured around three pillars: rate differentials and their expression through key currency pairs, the SOFR-SORA cross-currency basis as a funding-market signal that reveals whether the dollar’s decline is structural or masking liquidity stress, and yield curve dynamics as the market's assessment of the fiscal and policy backdrop. Cross-asset signals from gold and equities are also integrated throughout as corroborating evidence.
The transmission chains from Sections 1 and 2 converge here. The PPI-PCE pipeline traps the Fed by preventing rate cuts, delaying rate differential compression while intensifying the bear steepening as the front end stays anchored and the long end reprices fiscal risk. The twin deficit deterioration feeds directly into rising term premium, gradually eroding the dollar's structural floor. Meanwhile, the Iran conflict presents a paradox: elevated oil prices support the dollar through safe-haven demand today, but the same energy shock is feeding producer-level inflation that will eventually pass through to PCE, tightening the very constraint that prevents the Fed from cutting and prolongs the dollar’s vulnerability. The SOFR-SORA basis distinguishes between these competing forces in real time: a stable basis confirms the decline is orderly, while a widening basis warns of a funding squeeze and imminent dollar snap-back.
The sections that follow identify where asymmetries are building, and where the market's current pricing has not yet caught up with the signals the data is sending.
3.1 Rate Differentials: The Compression Thesis
Rate differentials are the single most important driver of dollar valuation, and their compression is the central mechanism through which USD depreciation cycles begin. While significant compression has already occurred, the dollar has remained resilient. However, the next phase matters disproportionately more because further compression narrows the distance to thresholds where carry trades become unprofitable and forced unwinding accelerates the move.
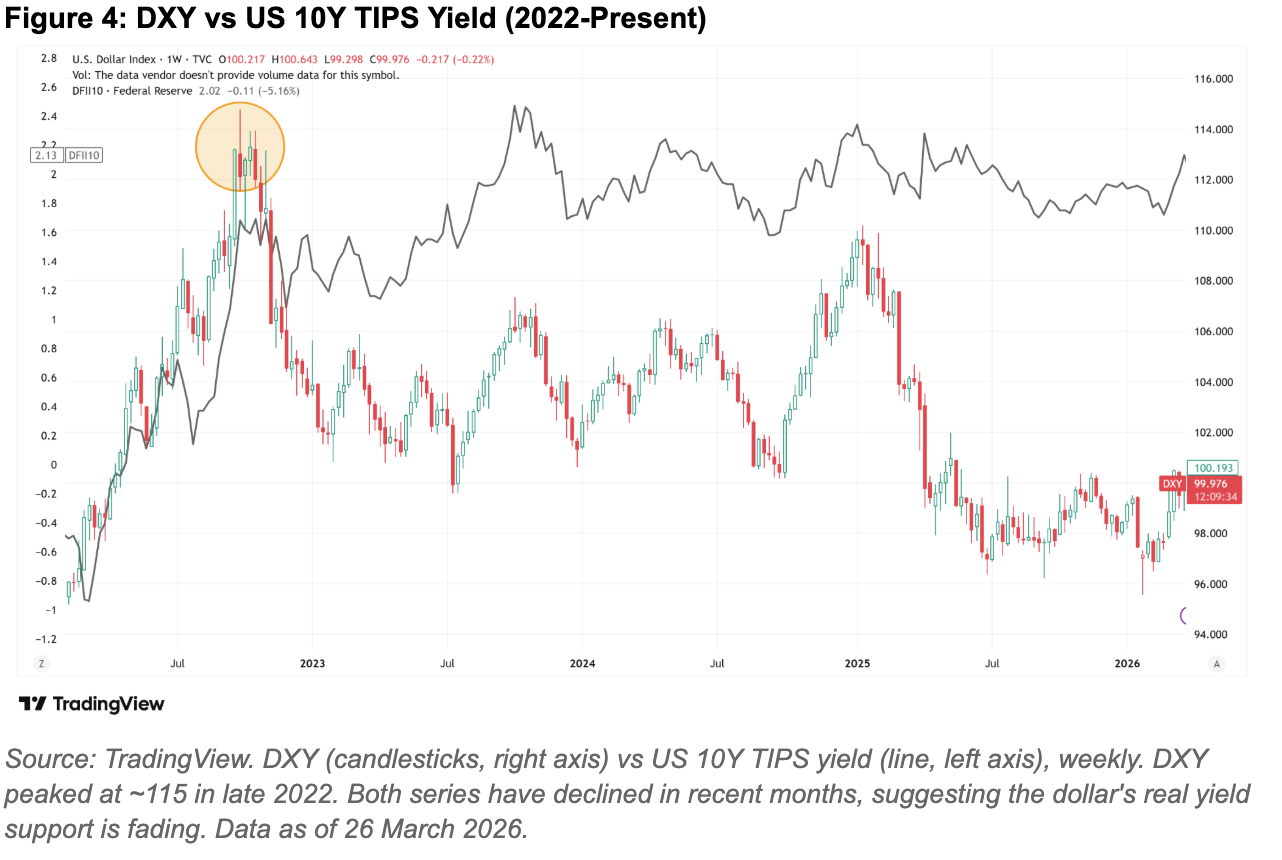
Figure 4: DXY vs US 10Y TIPS Yield (2022-Present)
Data: US 10Y at 4.42%. Japan 10Y at 2.27% (10Y spread: ~215 bp, compressed from ~350 bp in early 2024). Germany 10Y at 3.08% (10Y spread: ~134 bp, compressed from ~200 bp in early 2024). At the front end, US 2Y at 3.96%. Japan 2Y at 1.34% (2Y spread: ~262 bp). US 10Y real yield at ~2.08%. Aggregate speculative positioning has shifted net short USD for the first time since 2021.
Meaning: The direction and velocity of compression matters more than the level. Dollar depreciation cycles historically begin when the US rate premium narrows from ~100 bp from peak. We are ~136 bp into that process on the US-Japan 10Y spread (from ~350 bp in early 2024 to ~215 bp now).
Historical Context: The 2002-2008 cycle saw roughly 100 to 150 bp compression in the US-Japan 10Y spread on a sustained basis, as the DXY fell around 41%.
Overall, however, the current 2Y spread is the more actionable signal. At ~262 bp (US-Japan), the carry trade remains profitable, but each BOJ hike erodes this by ~25 bp, and with forecasts of two more hikes to 1.25% by end-2027, with June 2026 as the next likely move, the spread will likely compress further, potentially significantly if the Fed simultaneously cuts. The critical question is then where the carry breakeven flips after hedging costs, a threshold that further BOJ hikes are likely to steadily approach. The BOJ held at 0.75% in March 2026 with an 8-1 vote, Takata dissenting for 1.0%, and Governor Ueda citing the need for more time to assess the Iran conflict, but the hold reflects caution on timing rather than doubt about direction.
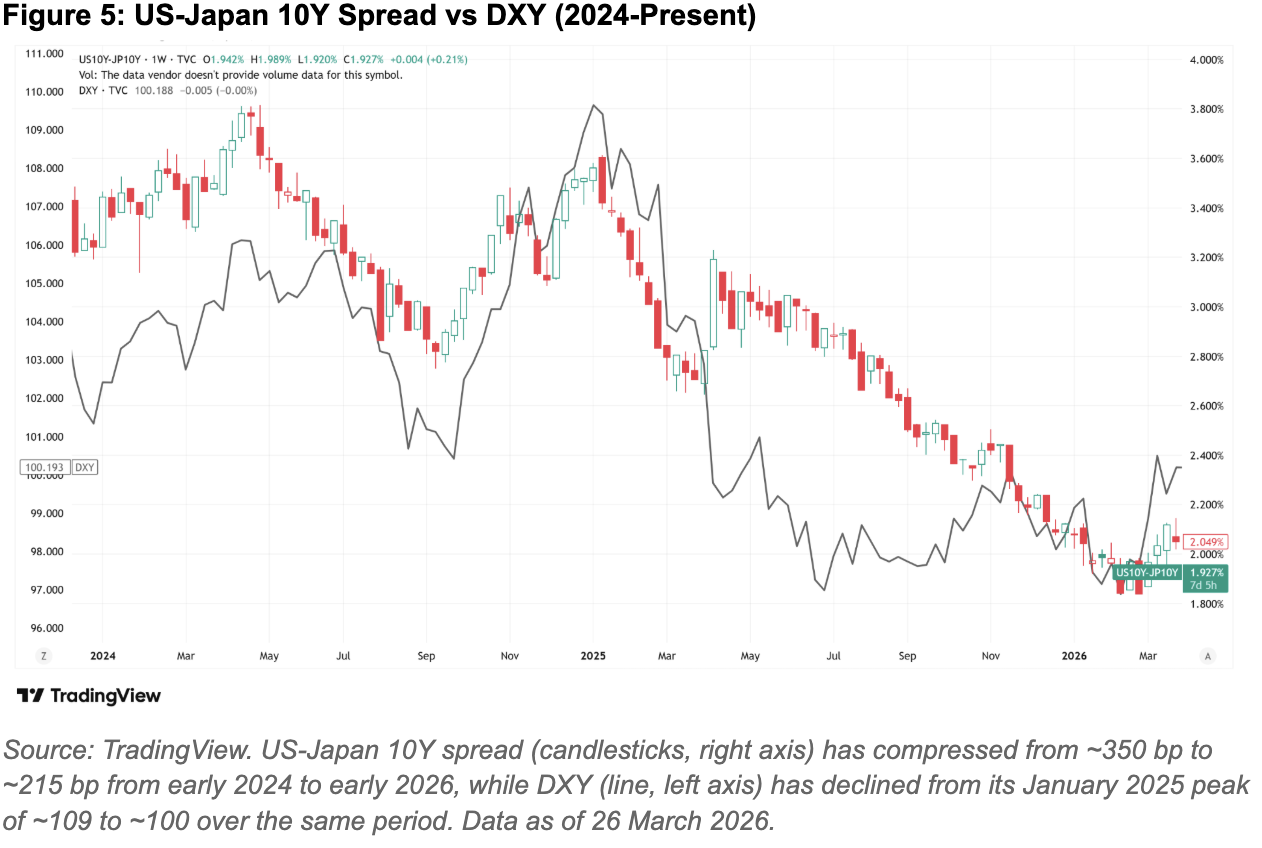
Figure 5: US-Japan 10Y Spread vs DXY (2024-Present)
On the Europe side, the ECB held at 2.0% in March 2026 with a hawkish bias, and OIS markets have priced a cumulative 43 bp of tightening by end 2026, a dramatic reversal from easing expectations in January 2026.
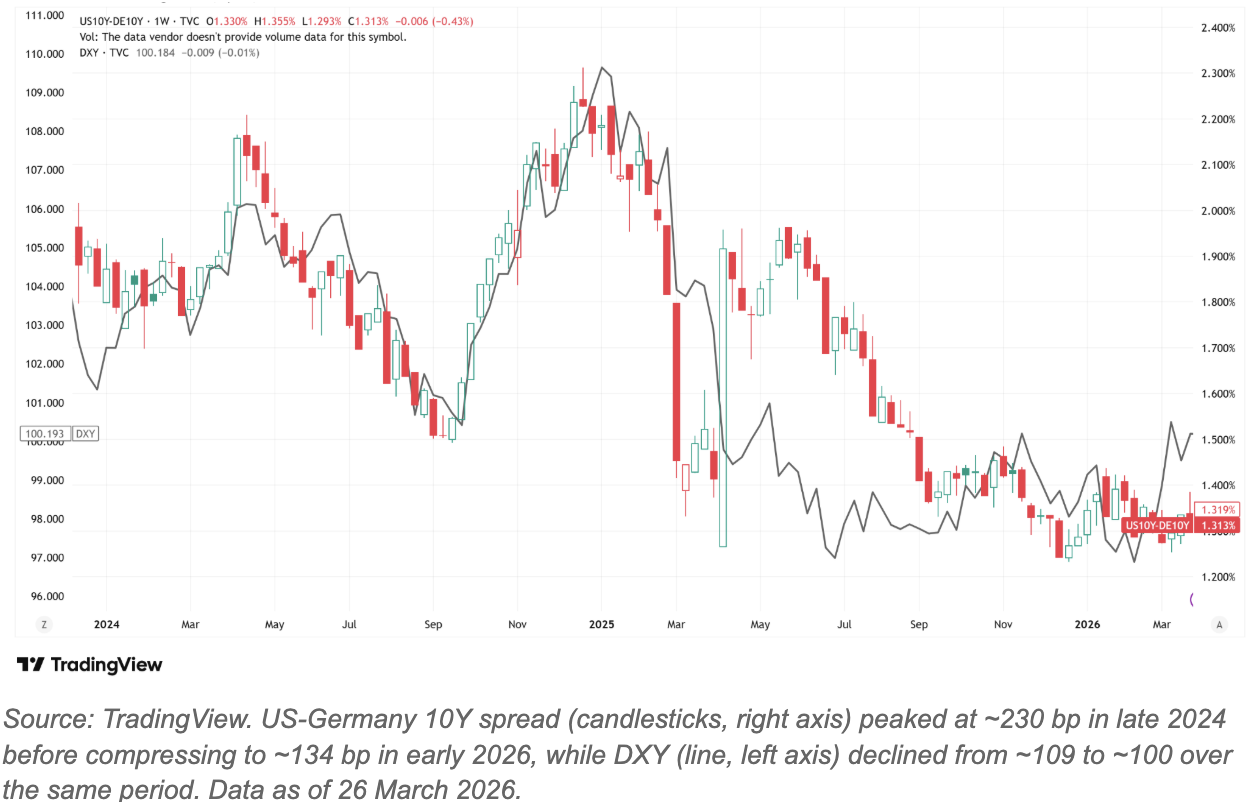
Figure 6: US-Germany 10Y Spread vs DXY (2024-Present)
Both the BOJ and ECB are thus signalling a tighter policy while the Fed holds. This is the core mechanism: spreads compress from both sides simultaneously.
Significance: The coincident indicators of 10Y spreads and DXY level reflect dollar resilience: spreads are still wide, with DXY holding near 100. However, the leading signals signal a different direction: 2Y compression is accelerating, positioning has shifted net-short USD, and the term premium sits at decade highs. The market has recognised the direction but has not yet priced the magnitude; positioning is short but not yet at historically crowded extremes, leaving room for further build-up if the data confirms.
The median dot still projects one cut in 2026, but if core PCE remains at or above 3.1% through Q2, which the PPI-PCE transmission channel strongly suggests, the dot plot cannot shift dovish at the June FOMC. Rate differentials therefore compress primarily from foreign central banks (BOJ hikes, ECB tightening) rather than from the Fed.
A critical asymmetry in positioning worth noting is that any positive USD catalyst such as a hot CPI print or an Iran escalation could trigger a short squeeze that temporarily strengthens the dollar. Conversely, a BOJ hike combined with a weak NFP report could accelerate the repricing sharply, with the 3M payroll average at ~+6,000 jobs per month, suggesting even a modestly negative March print would confirm the deterioration trend.
3.1.1 Where Compression Manifests: Key Currency Pairs
The dollar’s decline is not uniform across pairs, and each pair reflects a distinct combination of rate policy, growth trajectory and regional exposure to the current geopolitical shock.
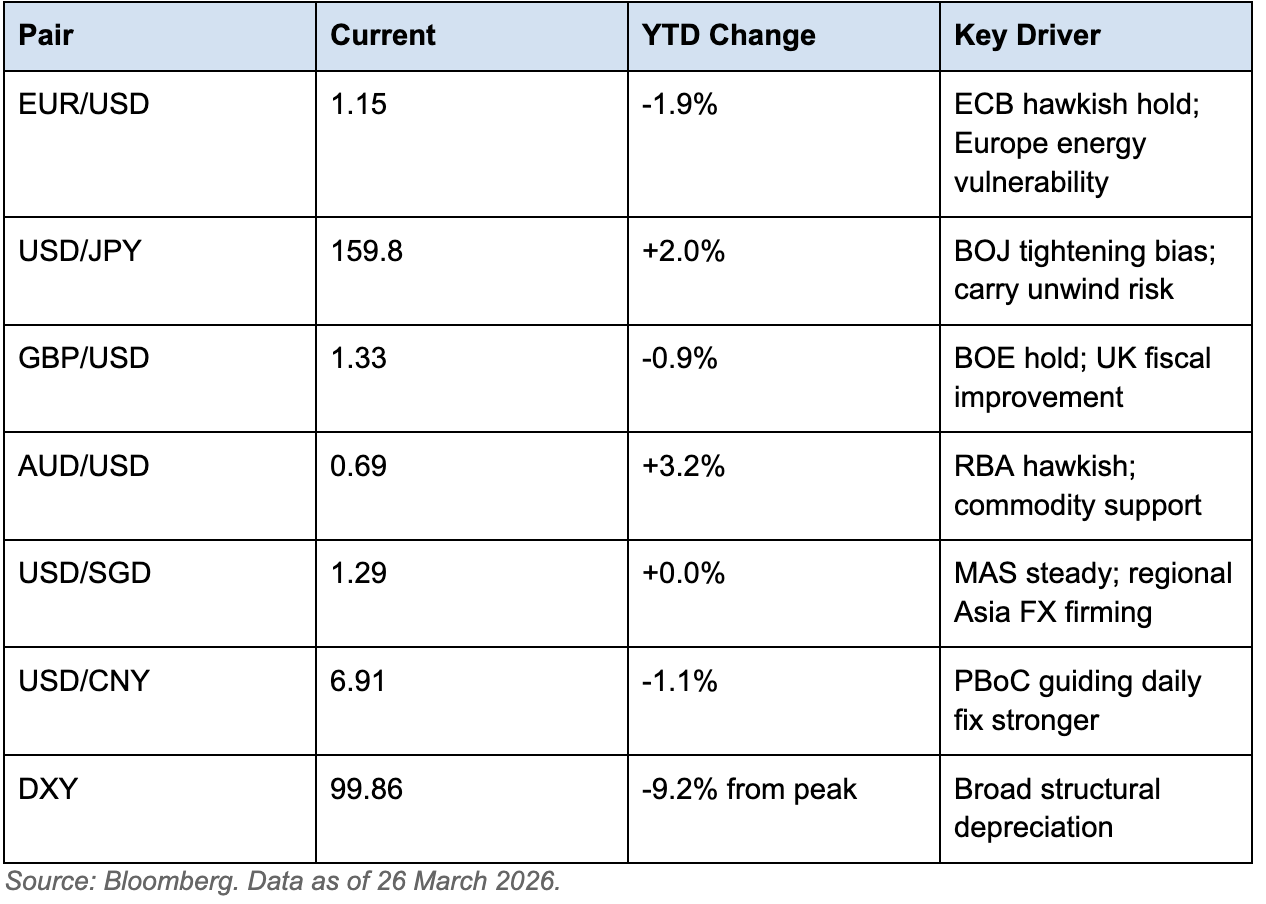
Figure 7: Key Currency Pairs and Drivers
We focus on two pairs that warrant deeper analysis: EUR/USD and USD/JPY.
EUR/USD (1.15, down 1.9% YTD)
Data: EUR/USD peaked at 1.15 in late January on broad dollar weakness before declining sharply from late February as Brent surged sharply from ~$70/bbl to over $105/bbl in late March. EURUSD positioning: 34% net short, the most bearish in over a year.
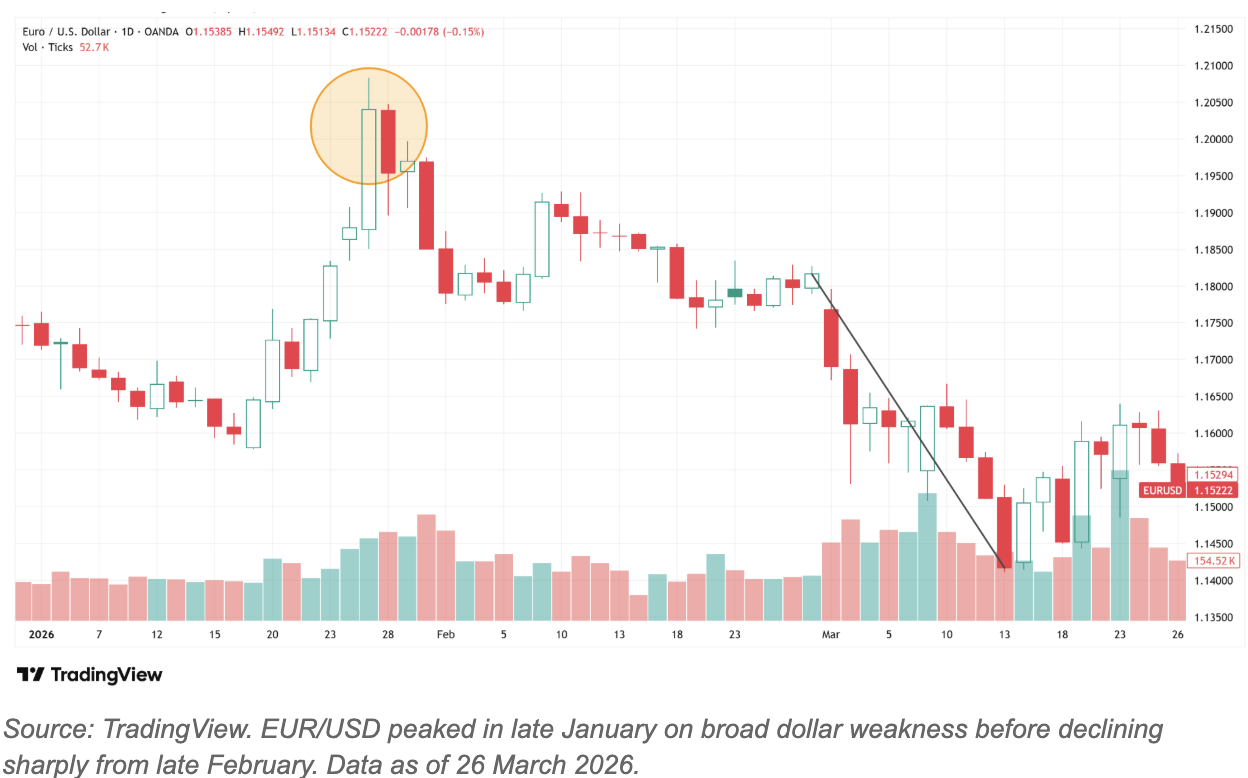
Figure 8: EUR/USD (YTD)
Meaning: The euro has surrendered its early-2026 gains as the Iran conflict exposed Europe's acute energy vulnerability. OIS markets have priced 43bp of ECB hikes for 2026 as the ECB faces pressure to tighten against an imported inflation shock it cannot control. This is the toxic paradox: hawkish repricing that should support the currency is instead occurring alongside deteriorating growth.
Significance: The regional divergence with the US is instructive. Both the Fed and ECB face the same PPI-to-consumer transmission lag from the oil shock, but the underlying growth backdrop is different. The US entered this shock with 2025 GDP growth at 2.1% and a labour market that was stalling but not broadly contracting. Europe entered with 2025 GDP growth at 0.9%, acute structural energy dependence (importing roughly 60% of its natural gas and 90% of its crude), and an industrial sector already under margin pressure. The ECB is therefore tightening into a weaker economy with a more direct transmission channel from oil to consumer prices, a configuration that historically produces currency weakness, not strength.
Impact: Moving forward, sell-side consensus points to EUR/USD at 1.17 by Q2 and 1.20 by Q4, but this rests on de-escalation in the Middle East, ECB pausing once the oil shock fades, and German fiscal stimulus providing a cyclical floor. If any one condition fails, EUR/USD trades closer to a lower range of around 1.12-1.15 through year-end.
USD/JPY (159.8, up 2.0% YTD)
Data: USD/JPY has risen from ~157 at the beginning of 2026 to 159.8 as of March 2026, approaching the 160 intervention threshold. The pair briefly plunged to ~152 in mid-February before recovering sharply, illustrating its non-linear volatility. Finance Minister Katayama has stated authorities are on ‘full guard’, and the BOJ’s tightening bias remains intact despite March’s hold.
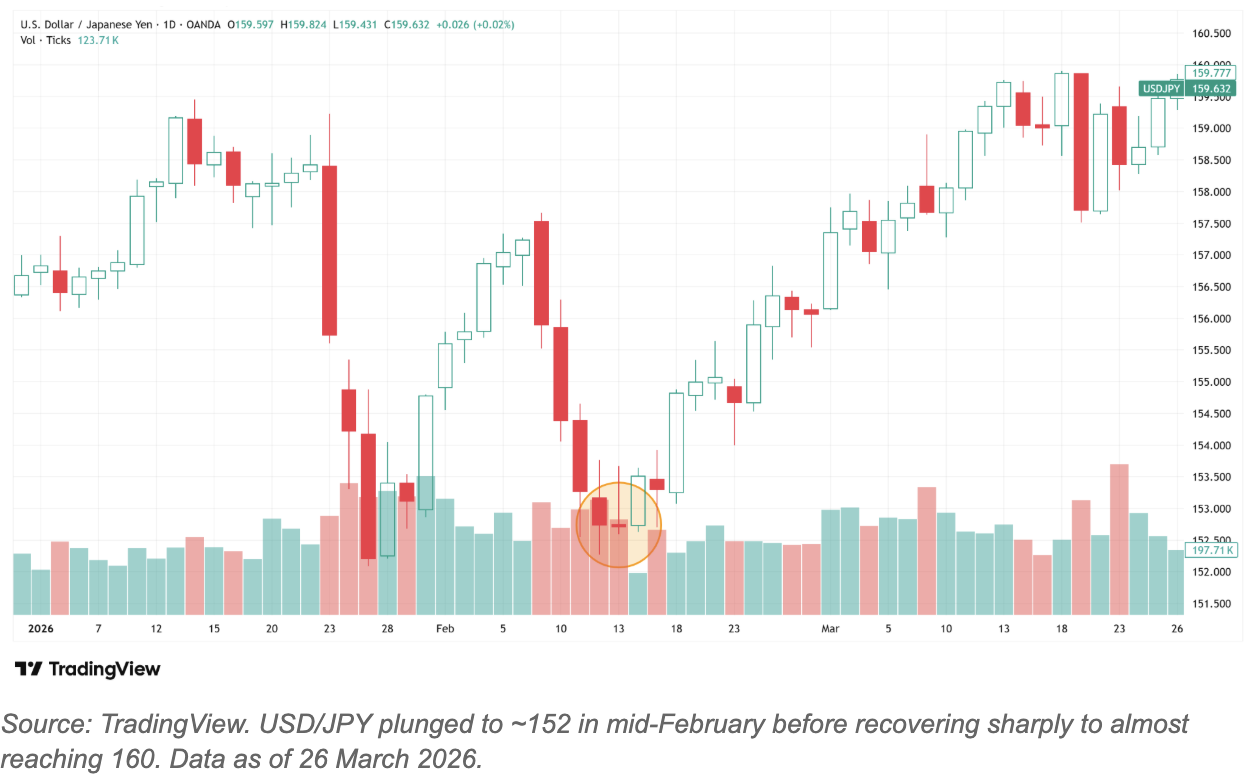
Figure 9: USD/JPY (YTD)
Meaning: USD/JPY is the pair most likely to produce a non-linear move. The risk is not the level but the velocity. The current grind towards 160 has been gradual, but a rapid move through 160 forces intervention via FX reserve sales. The pattern from 2022 and 2024 is established: verbal warnings escalate to rate checks, then to actual intervention, triggering a sharp JPY rally that propagates into broad USD weakness as carry positions unwind across G10.
Significance: The BOJ's pre-emptive tightening bias means the US-Japan spread compresses independently of what the Fed does, even if the Fed holds indefinitely. This gives USD/JPY a structural downward trajectory that intervention risk could accelerate sharply at any point.
Impact: Moving forward, sell-side consensus points to USD/JPY at ~150 by Q4 2026. The move, when it comes, is unlikely to be gradual. With intervention risk and carry unwind dynamics, the move could compress into a matter of weeks, with spillover into broad USD weakness.
3.2 Yield Curve Dynamics: Bear Steepening and the Term Premium Signal
The US yield curve has undergone a sustained bear steepening since mid-2025, with the 2s10s spread widening from 23 basis points to a peak of 72 basis points in early 2026, before settling near 46 basis points as of 26 March 2026.
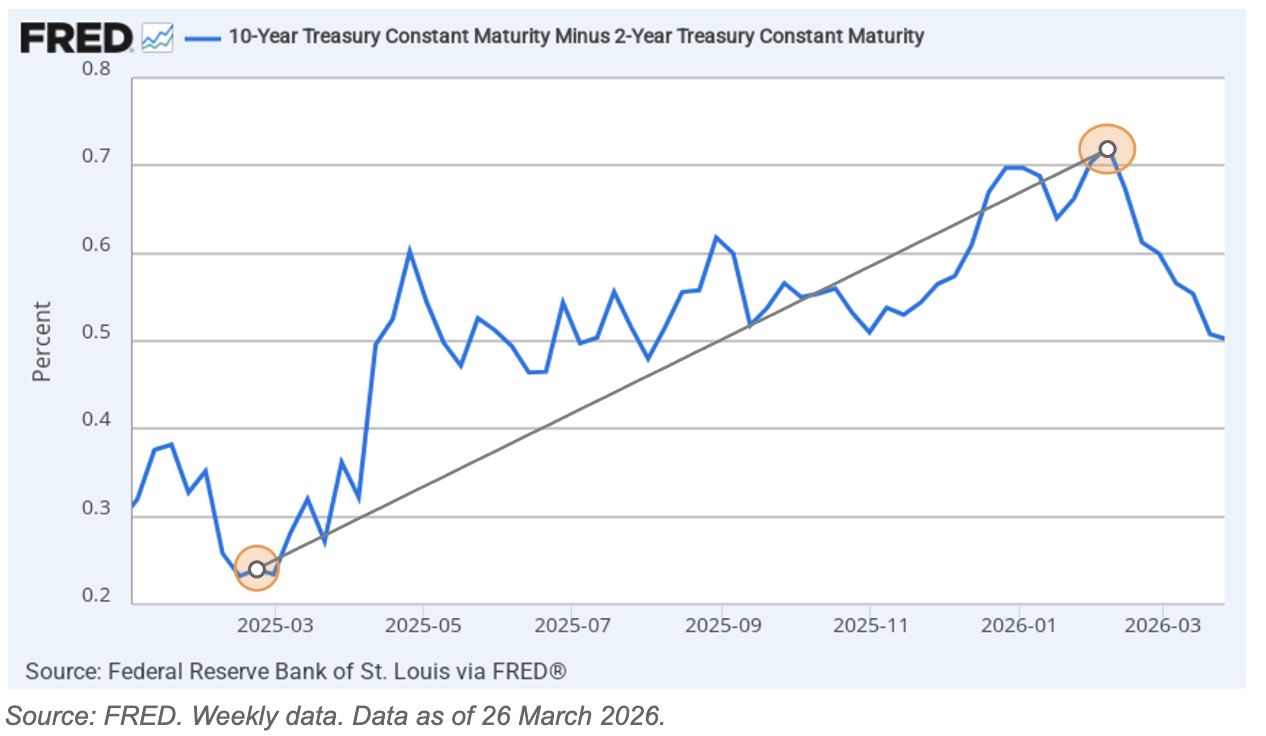
Figure 10: US 2s10s Spread (Jan 2025 - Mar 2026)
Data: US 2Y at 3.96%. US 10Y at 4.42%. 2s10s spread at +46 bp. Approximately $9 trillion of Treasuries need refinancing by end-2026, concentrated at the long end. Net interest on government debt is projected to reach $1 trillion in FY 2026.
Significance: Steepening of the yield curve is driven by two forces operating on different ends of the curve simultaneously.
At the front end, the curve is trapped. The binding constraint is the PPI-PCE transmission channel: pipeline inflation has not yet passed through to the consumer level, and when it does, it will push PCE higher and further delay easing. The only path to front-end relief is a labour market deterioration sharp enough to force the Fed's hand despite sticky inflation – the stagflationary bind that Section 2.1 identifies as the Fed's central dilemma. The 2Y at 3.96% reflects this precisely: the market believes the dot plot's one-cut projection, but suspects the macro data may not allow even that.
At the long end, the repricing reflects three reinforcing risks. First, fiscal sustainability. The deficit trajectory and the $9 trillion refinancing wall force the market to demand higher compensation for duration. The feedback loop is self-reinforcing – higher rates increase net interest costs towards $1 trillion, which widens the deficit, increases Treasury supply, and pushes rates higher still.
Second, foreign demand erosion. Central banks globally have trimmed Treasury holdings since the weaponisation of dollar reserves in 2022.
Third, the Warsh balance sheet channel: active MBS sales over passive runoff would inject additional supply into the long end precisely when the Treasury is already financing record deficits, simultaneously cutting the policy rate while steepening the curve through accelerated quantitative tightening.
The combination of a trapped front end and a repricing long end produces bear steepening of the yield curve, which reflects the market's simultaneous assessment that near-term policy is constrained by inflation and long-term fiscal sustainability is deteriorating. For the dollar, the near-term implication is support – elevated long-end yields continue to attract foreign capital. However, the medium-term implication is the opposite – curve steepening on fiscal concern rather than growth optimism gradually erodes dollar credibility rather than reinforcing it.
3.3 Cross-Asset Implications
FX: Structural Dollar Outlook
The central question is whether the dollar’s decline is orderly and structural, or whether it is masking funding stress that could snap back violently.
The DXY captures price, while cross-currency funding markets reveal whether the underlying flow of dollars between institutions is functioning normally or coming under strain. A currency can weaken on the spot market while dollar liquidity tightens in the background, and it is the funding market that ultimately determines whether a depreciation trend holds or reverses. When institutions globally scramble for USD, they sell local-currency assets and bid aggressively for dollars in repo and swap markets, driving funding costs sharply higher. This was the mechanism behind the paradoxical dollar surge of March 2020, where equities were collapsing, yet the dollar rallied violently because funding stress overwhelmed the directional trade.
The SOFR-SORA spread serves as a useful barometer of dollar liquidity conditions in Asian funding markets. The table below anchors what different regimes look like across distinct market episodes:
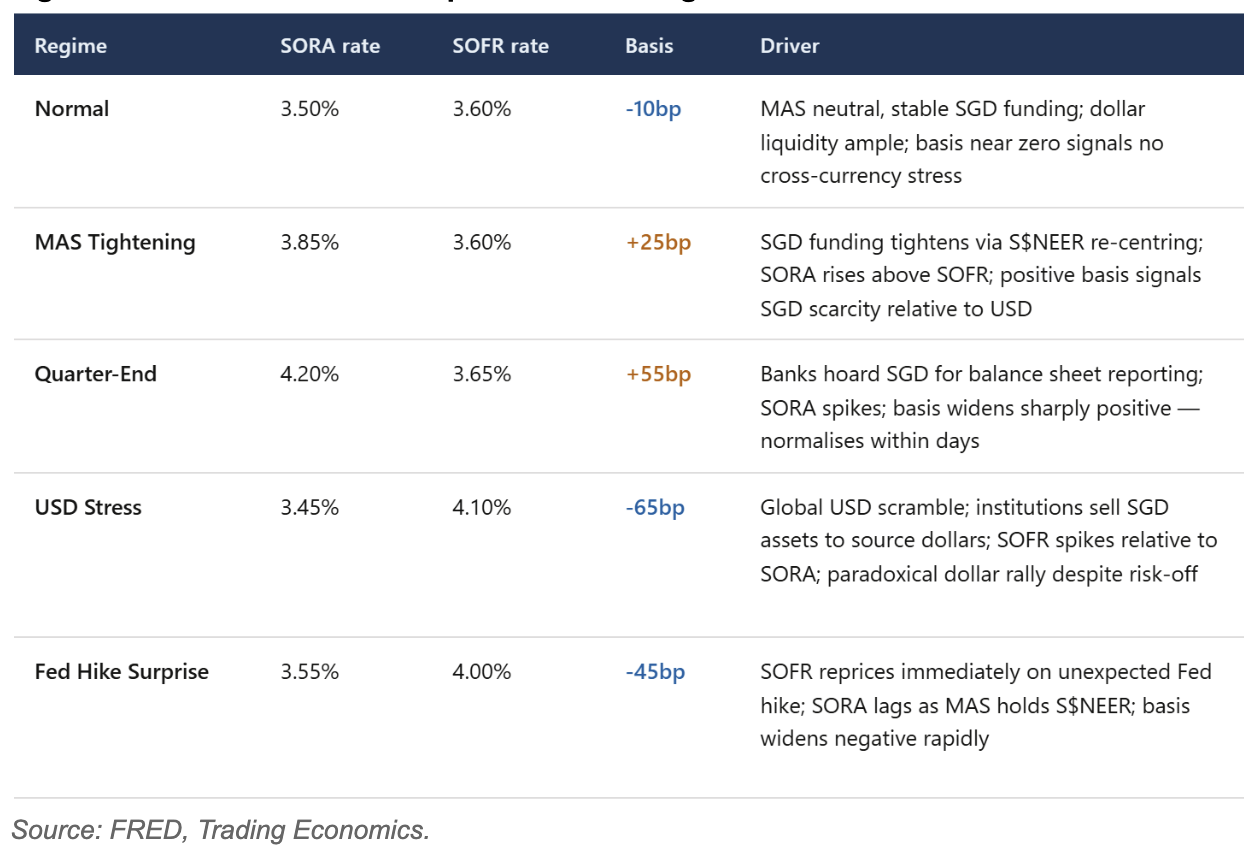
Figure 11: SOFR-SORA Basis Spread Across Regimes
Currently, with SORA at approximately 1.26% and SOFR at 3.63%, the observed spread is approximately -237 bp. This spread largely reflects the policy rate differential rather than genuine cross-currency funding stress. SORA has drifted lower as MAS eased its S$NEER policy stance, loosening domestic liquidity conditions, while the Fed held at 3.50-3.75%.
A true cross-currency basis swap, which strips out this rate differential, would typically read in the -10 bp to -50 bp range under normal conditions and move more negative under genuine stress. The spread is wide but not a stress signal in isolation. What matters here is not the absolute level but the rate of change, as a sharp and abrupt widening relative to its recent range would indicate funding stress layering on top of policy divergence, and not policy divergence alone.
For a cleaner read on dollar funding conditions, the preferred instrument is the 1-year USD/SGD cross-currency basis swap. It picks up marginal dollar funding demand more directly than the overnight spread and is less noisy, although it still gets affected by balance sheet costs, hedging flows, and regulatory dynamics. This should be monitored via Bloomberg or Reuters. A move beyond -30 bp would serve as a reasonable heuristic for building stress, although this threshold is not a fixed market convention but an analytical reference point.
As of March 2026, the three-way signal remains consistent with the structural depreciation base case. The DXY is declining. The absence of a disorderly gold rally suggests no acute flight to safety, and gold selling off alongside the dollar is more consistent with a broad rotation out of dollar-denominated assets than with a stress-driven scramble for safe havens, although gold weakness can also reflect rising real yields or positioning unwinds rather than pure rotation. Cross-currency funding conditions also show no signs of acute stress. A genuine stress episode would look entirely different: sharply negative basis swap, gold surging, dollar rallying despite risk-off in equities. None of those conditions are present.
The March 31 quarter-end may produce temporary dislocations or sharp moves in the overnight spread as banks compress balance sheets for reporting. The test is whether the basis normalises quickly in the following days. Persistence of stress signals into mid-April would be the first indication that dollar liquidity conditions are genuinely tightening beyond mechanical factors.
Rates: Front-End vs Long-End Dynamics
The Fed holding at 3.50-3.75% keeps SOFR anchored at approximately 3.63%, sustaining the rate differential that has driven SGD-denominated assets to outperform on a hedged basis through the easing cycle. The key rates question for the dollar outlook is whether the front end reprices dovishly, driven by softer US data or a Fed pivot signal, before the long end does. A bull steepening would be the most dollar-negative configuration, as it compresses carry advantage, can reduce FX hedging costs depending on cross-currency basis dynamics, and accelerates the structural rotation thesis.
Term premium appears to be rebuilding at the long end of the US Treasury curve, which partially offsets dollar weakness in that segment. The 2s10s spread is the key gauge to watch: bull steepening, where the front end rallies faster than the long end sells off, is the rates configuration most consistent with continued orderly dollar depreciation.
Equities and Risk Assets: Currency Transmission
A structurally weaker dollar is generally constructive for Asian and EM risk assets as it reduces the cost of USD-denominated debt servicing for regional corporates and sovereigns, improving credit conditions without requiring local central bank action, and historically correlates with a risk-on rotation into non-US equities as global investors reweight away from USD-denominated assets. However, the current episode differs from prior dollar depreciation cycles.
The decoupling signal: The S&P 500 is holding near 6,477 while the DXY has declined approximately 9.2% from its January 2025 peak. This is not the typical risk-on dynamic. In prior cycles, most visibly 2002-2008, dollar weakness and equity strength were jointly driven by global growth convergence and broad liquidity expansion. However, the current configuration is different, since US equity resilience is increasingly narrow and concentrated rather than broad-based, driven by AI earnings leadership in a small number of mega-cap names, while the dollar weakens on structural rate differential compression and fiscal deterioration. This decoupling means dollar depreciation from here will not translate uniformly into non-US equity outperformance. The transmission to non-US equities is therefore slower and more selective. Capital flows are increasingly alpha-seeking rather than beta-driven, liquidity is not evenly distributed across markets, and the oil shock is simultaneously creating a terms-of-trade headwind for Asian economies that partially offsets the FX tailwind.
The oil shock transmission: At approximately $105/bbl for Brent crude, the FX tailwind is real. Dollar weakness is improving the translation of local currency returns for USD-based investors. However, the real economic cost shock is running in the opposite direction, Elevated energy costs are directly compressing margins for Asian industrials, transport operators and consumer discretionary sectors with high import exposure. For Singapore-based investors, currency stability does not mean asset stability. A weaker dollar improves the FX tailwind while the same geopolitical shock driving that dollar weakness simultaneously pressures the underlying corporate earnings of regional holdings. The net equity impact is thus not uniformly positive but depends heavily on sector exposure, with energy importers facing meaningful headwinds even as the FX tailwind builds.
The Warsh balance sheet channel: The third and least-priced equity risk in the current environment is the Warsh balance sheet channel. If confirmed, Warsh's preference for active MBS sales over passive runoff would gradually but significantly drain dollar liquidity from global risk assets. Markets would first price the expectation, then react to actual implementation, making the timing non-linear but the direction clear. The 2022 episode established this: aggressive quantitative tightening compressed equity multiples across G10 and EM markets simultaneously, with high-duration assets, including technology, growth equities, long-dated sovereign bonds, bearing the sharpest adjustment. A repeat of active balance sheet reduction into an already fragile liquidity environment represents the highest-convexity risk to Asian equity positioning that the base case does not currently capture. For Singapore-based investors, the practical implication is to monitor the Warsh confirmation timeline and early signals on balance sheet policy as a leading indicator for regional equity volatility.
Singapore-specific sensitivity: The key regional sensitivity for Singapore is the SGD's managed exchange rate regime. SGD can exhibit safe-haven characteristics within Asia, tending to hold relatively well in regional risk-off episodes, but it is not a pure safe haven like that of CHF or JPY. Critically, currency stability does not equal asset stability. SGD-based investors holding regional risk assets can still face compressed portfolio returns during stress episodes even when the currency itself holds, because the underlying assets are performing in local currency terms while regional risk-off sentiment weighs on valuations. However, although the current environment does not suggest acute stress, monitoring is important if geopolitical risk escalates further.
The signal is clear: a sharp equity selloff combined with the 1Y USD/SGD basis swap moving more negative confirms funding stress is layering onto the risk-off move. At that point, the structural depreciation thesis no longer holds.
4. Scenario Analysis (2-6 Month Horizon)
Based on the analyses in the preceding sections, there are three distinct paths for the dollar, each defined by specific macro conditions and policy responses. Rather than offering a single-point forecast, this section identifies the conditions under which each scenario materialises and the signals that confirm which path is unfolding.
4.1 Base Case: Controlled Depreciation (High Probability)
DXY target: 95-97 by September 2026. This target is derived from the rate differential compression framework in Section 3.1. The DXY's decline from its January 2025 peak of ~109 to ~100 today (~9%) has tracked the compression of the US-Japan 10Y spread from ~350 bp to ~215 bp, a ratio of roughly 1% DXY decline per ~15 bp of spread narrowing. This ratio is a heuristic derived from the current cycle rather than a stable cross-cycle relationship, as the sensitivity of the dollar to rate differentials varies with positioning, liquidity conditions and the macro regime; however, it provides a useful order-of-magnitude anchor for scenario construction.
Under base case assumptions of one Fed cut (~25 bp lower on the US side), one BOJ hike to 1.0% (~25 bp higher), and continued ECB tightening compressing the US-Germany spread from ~134 bp, aggregate G10 rate differentials narrow by an additional 50-70 bp. This implies a further 3-5% DXY decline from ~100 to the 95-97 range, with a floor near the September 2025 technical low at 96.5.
Forecasted rationale: The Iran conflict remains contained but unresolved, keeping oil in the $90 to 105 range. The Fed delivers one 25 bp cut in September or November 2026, conditional on core PCE easing towards the ~2.5% threshold at which the Fed has historically demonstrated willingness to resume easing, as it did in September 2024. This requires the oil shock to stabilise and tariff pass-through to fade, consistent with the median dot projection. The risk to this path is that the PPI-PCE pipeline analysed in Section 2.1 prevents core PCE from declining meaningfully from its current 3.1%, deferring the cut into 2027 and keeping the DXY closer to 97-99. The BOJ raises rates to 1.0% by mid-year, with a meaningful share of economists expecting a move as early as April or June. Growth convergence between the US and G10 accelerates modestly as the Eurozone recovers towards its pre-conflict growth trajectory of 1.2% GDP, supported by German fiscal stimulus.
The wide spread between core PPI at 3.9% and core PCE at 3.1% suggests a brief inflation scare in Q2 as pipeline pressures pass through to consumer prices, followed by moderation as tariff effects fade and the oil shock stabilises. Gold likely resumes its uptrend towards $5,000+ as the profit-taking correction runs its course, supported by continued central bank purchases. The dollar depreciates gradually as rate differentials narrow and the geopolitical premium fades.
Key catalysts: The February core PCE release (April 9) tests the PPI-to-PCE transmission – a print holding at or near 3.1% would suggest the pass-through remains contained, validating this scenario. A print above 3.3% would signal accelerating transmission and shift probability towards the upside scenario. The March NFP report provides the second labour market reading. The June 16-17 FOMC dot plot is the pivotal signalling event: if the median shifts from one cut to two, supported by softening payrolls, the market reaction in rates and FX could be decisive.
4.2 Upside Scenario: Extended Safe-Haven Strength (Mid Probability)
DXY target: 99-102 through September 2026. Under this scenario, the rate differential compression described in Section 3.1 stalls as the BOJ pauses and the Fed holds, keeping the US-Japan 10Y spread near its current ~215 bp and the US-Germany spread near ~134 bp. The dollar also retains its current yield advantage, and the DXY holds near 100, with potential to push towards 102 on a safe-haven liquidity squeeze, still well below the January 2025 peak of ~109.
Forecasted rationale: The Iran conflict escalates significantly, disrupting Strait of Hormuz shipping and pushing Brent above $120. The $120 threshold is grounded in the chokepoint mechanics: approximately 20% of global oil supply transits the Strait. Disruption to this flow has historically produced $15-30/bbl spikes. For example, the 2019 Abqaiq drone attack spiked Brent ~$12 overnight from a lower base. From the current ~$105, a $15-20 escalation premium reaches $120–125.
Global recession fears intensify. The Fed is forced to hold rates or consider hikes as headline inflation approaches 3.5-4.0%. The transmission channel is oil-to-CPI: each sustained $10/bbl increase in crude adds approximately 0.2-0.3 percentage points to headline CPI within 3-6 months. A move from $105 to $120 sustained adds ~0.3-0.5 pp, pushing headline CPI from ~3% towards 3.5%. Reaching 4% would additionally require the PPI-PCE pipeline to layer on top, which is plausible but at the extreme end of this scenario.
Key risk: PPI at 3.4% YoY and rising suggests this scenario is more probable than the market is currently pricing. The 2Y yield at 3.96%, now above the EFFR, shows the bond market has already begun pricing hike risk, validating the near-term floor under the dollar.
4.3 Downside Scenario: Accelerated Depreciation (Mid Probability)
DXY target: 92-95 by September 2026. Under this scenario, aggressive Fed easing (~75 bp of cuts) combined with multiple BOJ hikes (to 1.25%) compresses rate differentials by approximately 125 bp, implying an ~8% DXY decline from current levels using the compression ratio established in Section 3.1, consistent with the 92-95 range.
Forecasted rationale: A rapid de-escalation in Iran, combined with a sharper-than-expected US growth slowdown triggered by cumulative tariff, energy and federal workforce reduction effects, puts pressure on the Fed to enter an aggressive easing cycle. Warsh's confirmation and subsequent dovish pivot on rates, while maintaining balance sheet hawkishness, further accelerates rate expectations. The 2Y yield snaps back from 3.96% towards 3.20-3.40% as the market reprices from hike expectations to multiple cuts, compressing rate differentials violently.
The BOJ hikes to 1.25%, compressing the US-Japan 2Y spread from ~262 bp towards ~212 bp, hence approaching, but not yet breaching, the ~175 bp carry breakeven. The threat of further hikes triggers pre-emptive position liquidation before the breakeven is reached, producing the non-linear USD/JPY selloff identified in Section 3.1 as the highest-convexity G10 risk. Under this scenario, USD/JPY tests the 145-148 range by Q3 as the carry unwind accelerates and intervention risk recedes with the yen strengthening on its own fundamentals. EUR/USD tests 1.20 as European rate differentials narrow and the energy shock fades. Twin deficit repricing begins as foreign Treasury demand softens under the weight of the $9 trillion refinancing wall and rising term premium.
Key catalysts: March and April employment reports. With the 3M average at +6,000 jobs/month, a second consecutive negative NFP print shifts the market from pricing one cut to pricing three or more. From the current 2Y yield of 3.96%, that repricing would be dramatic, producing a DXY selloff of 3-5% within weeks.
4.4 Scenario Assessment
Overall, the base case carries the highest probability because it aligns with the Fed's own median dot projection of one cut and the macro regime of stalling but not collapsing growth. The upside and downside scenarios each require a decisive break in the Iran conflict in either direction, while the base case requires only continuation of the current ambiguity.
The upside and downside are weighed equally because the tail risks are symmetric over the 2-6 month horizon. On the upside, the PPI-PCE pipeline suggests inflation is more likely to surprise higher than fade quickly, supporting dollar strength through elevated real yields and safe-haven demand. On the downside, the labour market's proximity to stall speed and the concentration of catalysts in June, where the FOMC dot plot, BOJ decision and potential conflict de-escalation land within days of one another, create an equally plausible path to a sharper dollar selloff. The structural direction favours the downside, but near-term inflation and geopolitical dynamics favour the upside. As to which force dominates, it will become clear through the April-June data window, and the relative weighting between these scenarios should be reassessed as each data point prints.
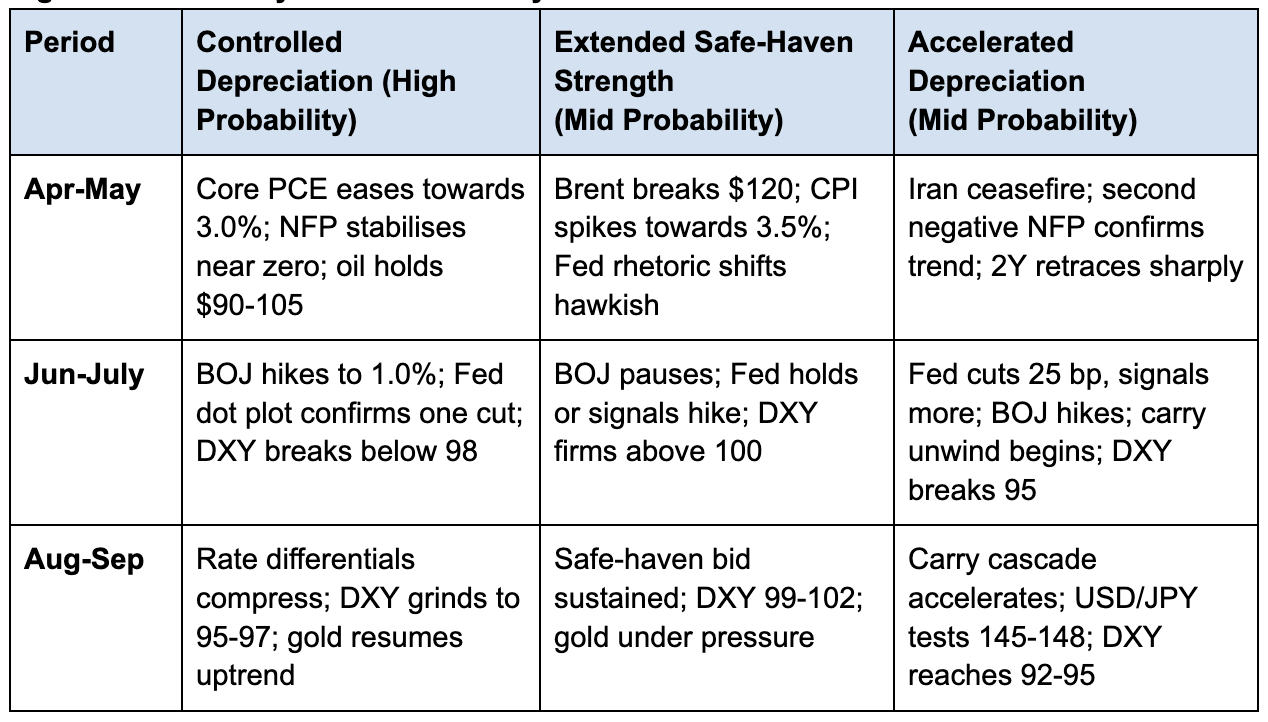
Figure 12: Summary of Scenario Analysis
5. Key Catalysts, Timeline and Risks
5.1 Catalysts & Timeline
The densest cluster of catalysts falls between April and June 2026. Each data point either validates or undermines the preceding one, signalling the dollar’s next directional move.
April 3 – March NFP Release: The pivotal labour market reading. A rebound would suggest the weakness was transitory; a second consecutive negative print would confirm a deteriorating trend and shift pricing from one cut to three or more.
April 9 – February Core PCE Release: The first test of the PPI-PCE transmission. A print holding at or near 3.1% would suggest pipeline pressures remain contained, validating the base case. A print meaningfully above 3.1% would signal that the PPI-PCE pass-through is accelerating, shifting probability towards the upside scenario and further reducing the likelihood of a cut in June.
April 10 – March CPI Release: Landing just 24 hours after the core PCE print, this release tests the CPI-PCE divergence thesis in real time. The gap between core CPI (2.5% YoY) and core PCE (3.1% YoY) has been a persistent theme of this cycle, and the back-to-back releases will either confirm the divergence is widening, reinforcing the argument that investors watching CPI alone are receiving a misleadingly benign inflation signal, or show initial signs of convergence.
April 14 – March PPI Release: This is the most consequential inflation data point in the near term for the core thesis of this report. The PPI-PCE spread is the central timing signal for the dollar's structural depreciation: the gap only closes through either rising consumer prices or employment cuts, and both paths are stagflationary. The February reading of 0.7% MoM and 3.9% YoY for core PPI was the hottest in a year. If March sustains that pace, it confirms the pipeline is building rather than dissipating, and the probability that core PCE re-accelerates through Q2 rises materially. Conversely, a moderation below 0.4% MoM would be the first signal that the pass-through may be peaking, reopening the path to a Fed cut in H2.
Together, the April 9-14 window delivers PCE, CPI and PPI within five trading days, the most concentrated inflation data cluster of the year. By April 14, the market will have a near-complete picture of whether pipeline inflation is accelerating, stabilising or fading, and the FOMC will have all three inputs ahead of its April 28-29 meeting.
April 27-28 – BOJ Meeting: Bank of America’s base case for the next hike to 1.0%.
April 28-29 – FOMC Meeting: The first Fed decision following four critical data releases (NFP, PCE, CPI and PPI). While this meeting does not include a Summary of Economic Projections, the statement and press conference will signal whether the committee's reaction function has shifted in response to the Q1 data.
The proximity of decisions by the Fed and BOJ within a 24-hour window creates the potential for rate differentials to compress from both sides simultaneously.
April 30 – Q1 2026 GDP Advance Estimate: Landing two days after the FOMC decision, this is the first comprehensive read on whether the growth deceleration evident in Q4 2025 (0.7% annualised) has deepened or stabilised. A print significantly below the Fed's March SEP projection of 2.4% for full-year 2026 would validate the stalling growth narrative and increase market conviction that the Fed will need to cut, even if inflation remains sticky. This would directly shift the probability weighting between the base case and the downside scenario.
May 4–6 – Treasury Quarterly Refunding Announcement: The Treasury releases its financing estimates on May 4 and the full policy statement, TBAC report and auction schedule on May 6. This is the mechanism through which the $9 trillion refinancing wall identified in Section 1.3 translates into concrete market pricing.
May 8 – April NFP Release: The second labour market reading. If March rebounds, this print tests whether the recovery is sustained or a one-off. If March is negative, this becomes the third data point in what would then be an unambiguous deterioration trend.
May 15 – Powell’s Term Expiry: If Warsh’s confirmation remains stalled, Powell continues in an interim capacity. Institutional ambiguity weighs on forward guidance credibility.
June 15-16 – Next BOJ Meeting: The next opportunity for a rate hike if the BOJ holds in April. By June, the BOJ will have additional data on the Iran conflict’s impact on Japan’s inflation trajectory and imported energy costs.
June 16-17 – Next FOMC Meeting + Dot Plot: The pivotal signalling event. The updated dot plot incorporates Q2 data, including two additional NFP prints, at least one more core PCE reading, and the cumulative effect of the oil shock on consumer prices. If the median shifts from one cut to two, it validates the base case. If it holds at one or moves to zero, the upside scenario gains probability.
For the second consecutive meeting cycle, the BOJ and Fed also decide within 24 hours of each other, reinforcing the compression dynamic. The repeated proximity also means that the previous cycle’s outcome is immediately tested again, compressing the timeline for the market to reach a directional consensus on rate differentials.
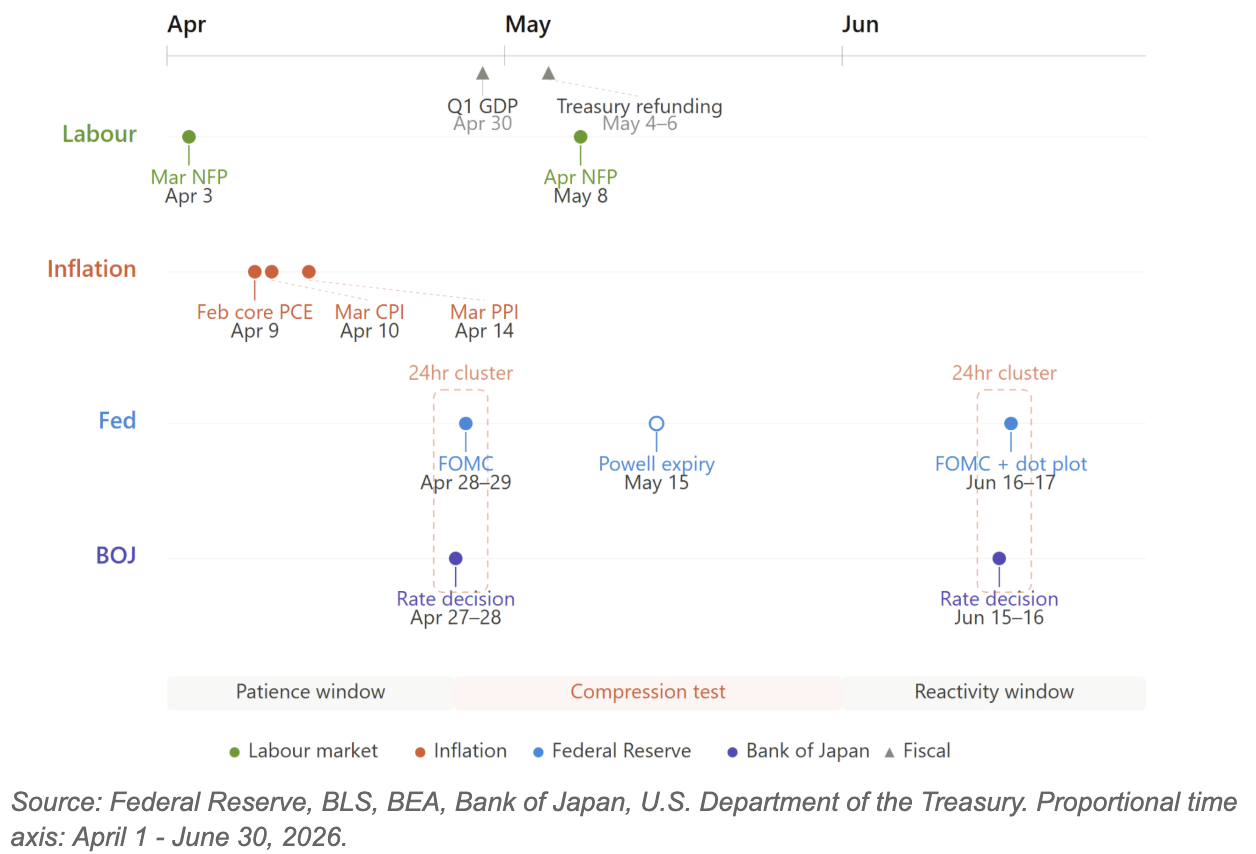
Figure 13: Key Catalyst Timeline (April-June 2026)
5.2 Risks to the Thesis
Risk 1: Energy Price Overshoot: If Brent holds above $120, the inflationary pressure forces the Fed deeper into its stagflationary bind. Each $10/bbl adds approximately 0.2-0.3 percentage points to headline CPI within 3-6 months via jet fuel and transport. This supports the dollar near term through safe-haven flows but accelerates its structural erosion via inflation, as per the paradox identified in Section 3.
Risk 2: Warsh Policy Surprise: If Warsh pursues active MBS sales instead of passive runoff, it would push additional supply into the long end, steepening the yield curve and disrupting equity markets. The net FX signal is thus mixed, as curve steepening on fiscal concern is bearish for the dollar, but risk-off equity flows would support it near term.
Risk 3: De-dollarisation Acceleration: If the BRICS gold-backed settlement unit gains traction or a major OPEC producer shifts crude invoicing away from dollars, the structural floor would erode faster than consensus expects. However, despite its high impact, this has a rather low probability of happening.
Risk 4: Labour Market Non-Linear Deterioration: The 3M average of +6,000 jobs/month signals near-stall speed growth. Moving forward, if the unemployment rate rises 0.3-0.5 pp in a single quarter, it would trigger the Sahm Rule. This would then force the Fed into emergency easing regardless of the inflation level and accelerate the downside scenario.
6. Concluding Takeaway
The dollar is at the threshold of a structural depreciation cycle. Although compressing rate differentials, widening twin deficits and a trapped Fed point towards depreciation, near-term support from the Iran conflict and elevated real yields have delayed the transition. The question is timing, not direction.
The PPI-PCE spread is the timing signal. Once core PPI falls below core PCE, it confirms that pipeline pressures have passed through and the inflation constraint on the Fed lifts, reopening the easing cycle. Until that happens, the pipeline keeps the Fed trapped and the front end anchored, hence driving bear steepening of the yield curve.
Our base case places the DXY at 95-97 by Q3 2026, representing a 3-5% depreciation from current levels. The dominant market behaviour to expect is a gradual, choppy descent punctuated by safe-haven rallies that offer tactical selling opportunities.
Tactical positioning: Between March and late April, the dollar retains support from the Iran conflict and the Fed's hawkish hold, with the 2Y above the EFFR confirming that the bond market is not yet ready to price cuts. Selling USD into this strength is premature. From late April, the calculus begins to shift. The back-to-back BOJ and FOMC decisions on April 27-29 provide the first test of the compression thesis, while the June 15-17 cluster, featuring the second BOJ decision and the FOMC dot plot, delivers the definitive signal. Together with potential conflict de-escalation, these catalysts could strip away the dollar’s remaining support and confirm the dollar’s transition to structural depreciation